Kubernetes Resources
kobs supports all Kubernetes objects like Pods, Deployments, StatefulSets and Custom Resources.
Note
Ensure that the satellite has enough permissions to retrieve all these resources from the Kubernetes API server. If you are using the Helm chart or Kustomize to install kobs, it will automatically create the correct Cluster Role and Cluster Role Binding, so that you can view, but not edit all these resources.
On the Kubernetes Resources page in kobs you can view all the resources available in you clusters. You can filter the list by clusters, namespaces and resources. You can also specify a label or field selector.
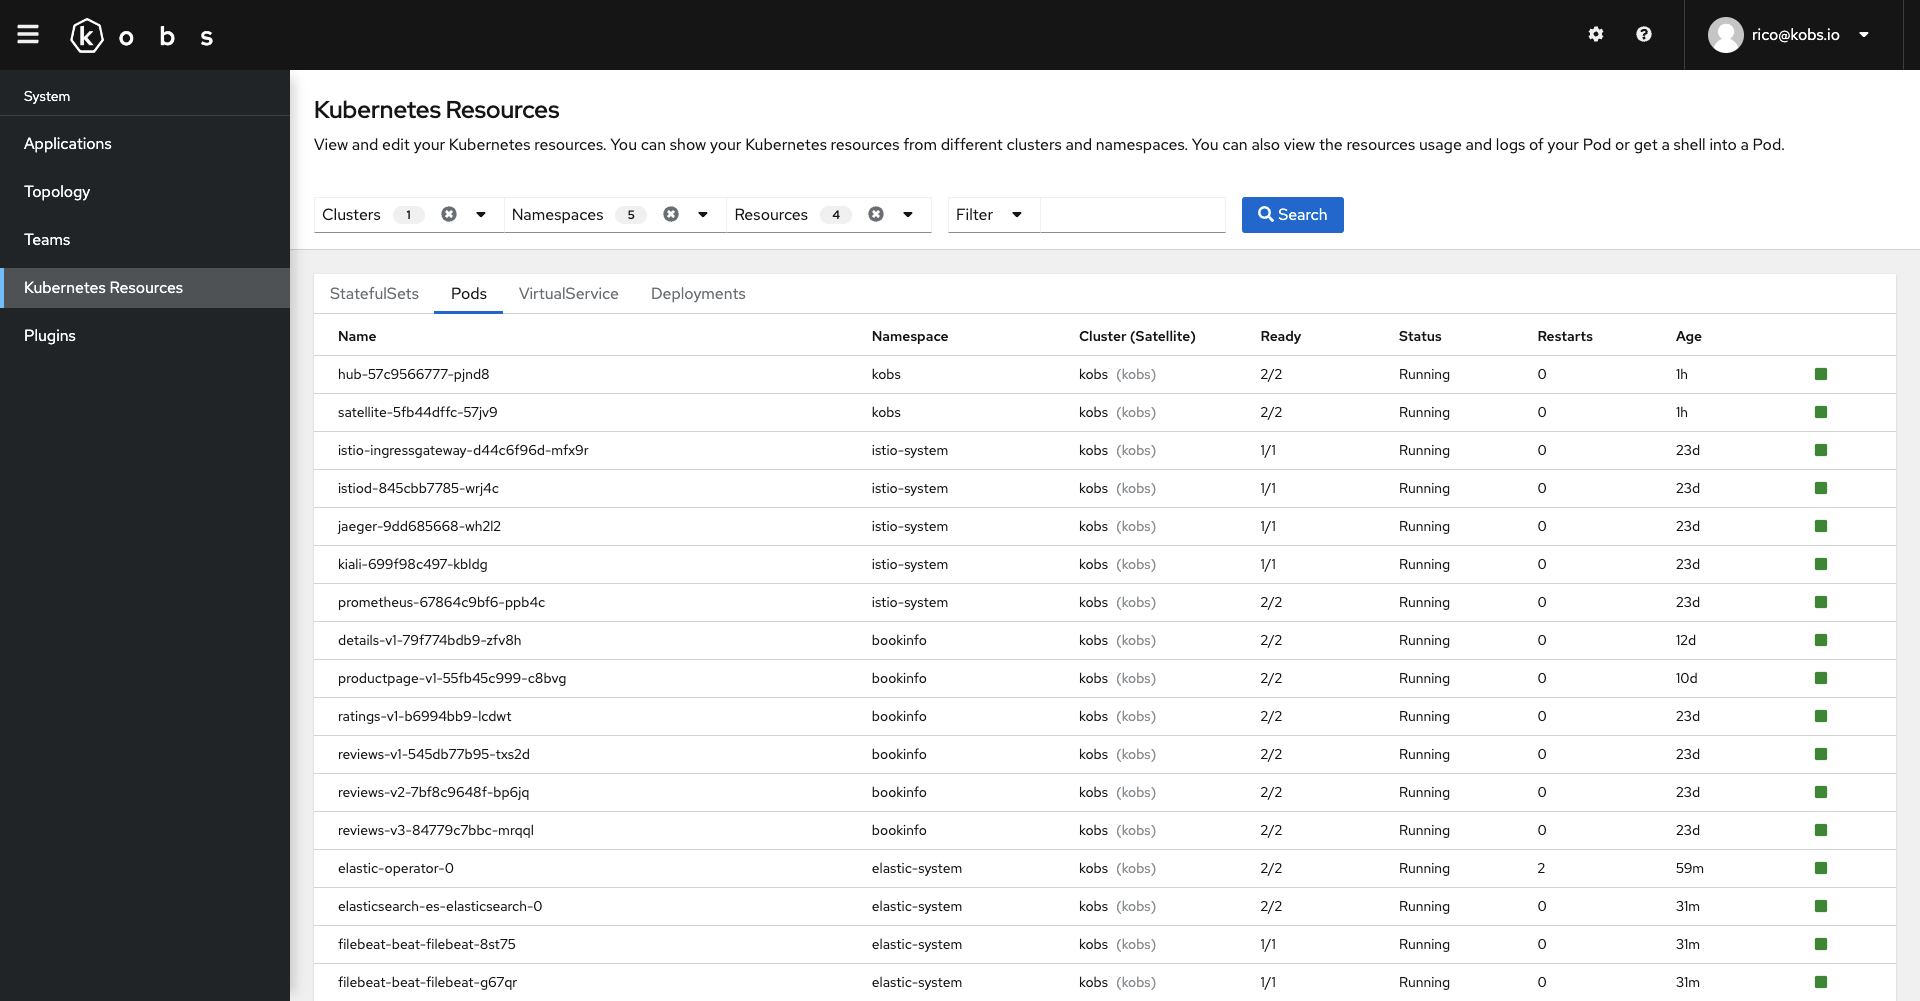
By selecting an item in the table, you can view more details for this resource. All the details can be found in the overview tab.

If you want to view the Yaml representation of the resource you can select the corresponding tab.

Next to the yaml representation, you find a second tab events, which shows all events, which are related to the selected object. The events are retrieved with a field selector and the name of the resource: fieldSelector=involvedObject.name=<NAME-OF-THE-RESOURCE>.

Actions
kobs provides several actions for all Kubernetes resources. These actions can be found in the upper right corner in the details view next to the close icon. For each resource it is possible to edit and delete the selected resource.
Next to these default actions, kobs also has some other actions for some resources:
- Scale Deployments, StatefulSets and ReplicaSets (
kubectl scale --replicas=3 deployment/bookinfo) - Restart DaemonSets, Deployments and StatefulSets (
kubectl rollout restart deployment bookinfo) - Trigger a CronJob manually (
kubectl create job --from=cronjob/backup backup-manual-qg0qjf) - View the logs of a Pod (
kubectl logs productpage-v1-55fb45c999-c8bvg). - Get a shell into a Pod (
kubectl exec -it productpage-v1-55fb45c999-c8bvg -c istio-proxy -- bash).

Dashboards
You can specify a list of dashboards for your Kubernetes resources, to get additional information. For example you can add a dashboard to a Pod to get the resource usage metrics from Prometheus or you can add a dashboard to a Deployment to view all the logs from Elasticsearch for this Deployment.
The dashboards can be configured via the kobs.io/dashboards annotation. They follow the same syntax as they can be configured for applications, users and teams.
You can use JSONPath within the dashboar dspecification, to use a value from the reosurce manifest in the dashboard, e.g. the name of the Pod <% $.metadata.name %>.
Note
We are using the jsonpath-plus to extract the content from the Kubernetes objects. A list of examples can be found within the documentation of the module.
In the following example we are adding the istio-http dashboard to the productpage-v1 deployment and the resource-usage dashboard to the pods of the deployment. We are also using the name of a pod (<% $.metadata.name %>) as placeholder in the dashboard.
---
apiVersion: apps/v1
kind: Deployment
metadata:
  name: productpage-v1
  namespace: bookinfo
  labels:
    app: productpage
    version: v1
  annotations:
    kobs.io/dashboards: |
      [
        {
          "name": "istio-http",
          "namespace": "kobs",
          "title": "Istio HTTP Metrics",
          "placeholders": {
            "namespace": "bookinfo",
            "app": "productpage"
          }
        }
      ]
spec:
  replicas: 1
  selector:
    matchLabels:
      app: productpage
      version: v1
  template:
    metadata:
      labels:
        app: productpage
        version: v1
      annotations:
        kobs.io/dashboards: |
          [
            {
              "name": "resource-usage",
              "namespace": "kobs",
              "title": "Resource Usage",
              "placeholders": {
                "namespace": "bookinfo",
                "pod": "<% $.metadata.name %>"
              }
            },
          ]
    spec:
      serviceAccountName: bookinfo-productpage
      containers:
        - name: productpage
          image: docker.io/istio/examples-bookinfo-productpage-v1:1.16.2
          imagePullPolicy: IfNotPresent
          ports:
            - containerPort: 9080
          resources: {}
          volumeMounts:
            - name: tmp
              mountPath: /tmp
          securityContext:
            runAsUser: 1000
      volumes:
        - name: tmp
          emptyDir: {}
