Applications
Applications are defined via the Application Custom Resource Definition. Applications can be used to improve the observability of your Kubernetes workloads. For that you can add metrics, logs, traces and other information via the different plugins to your Kubernetes resources.
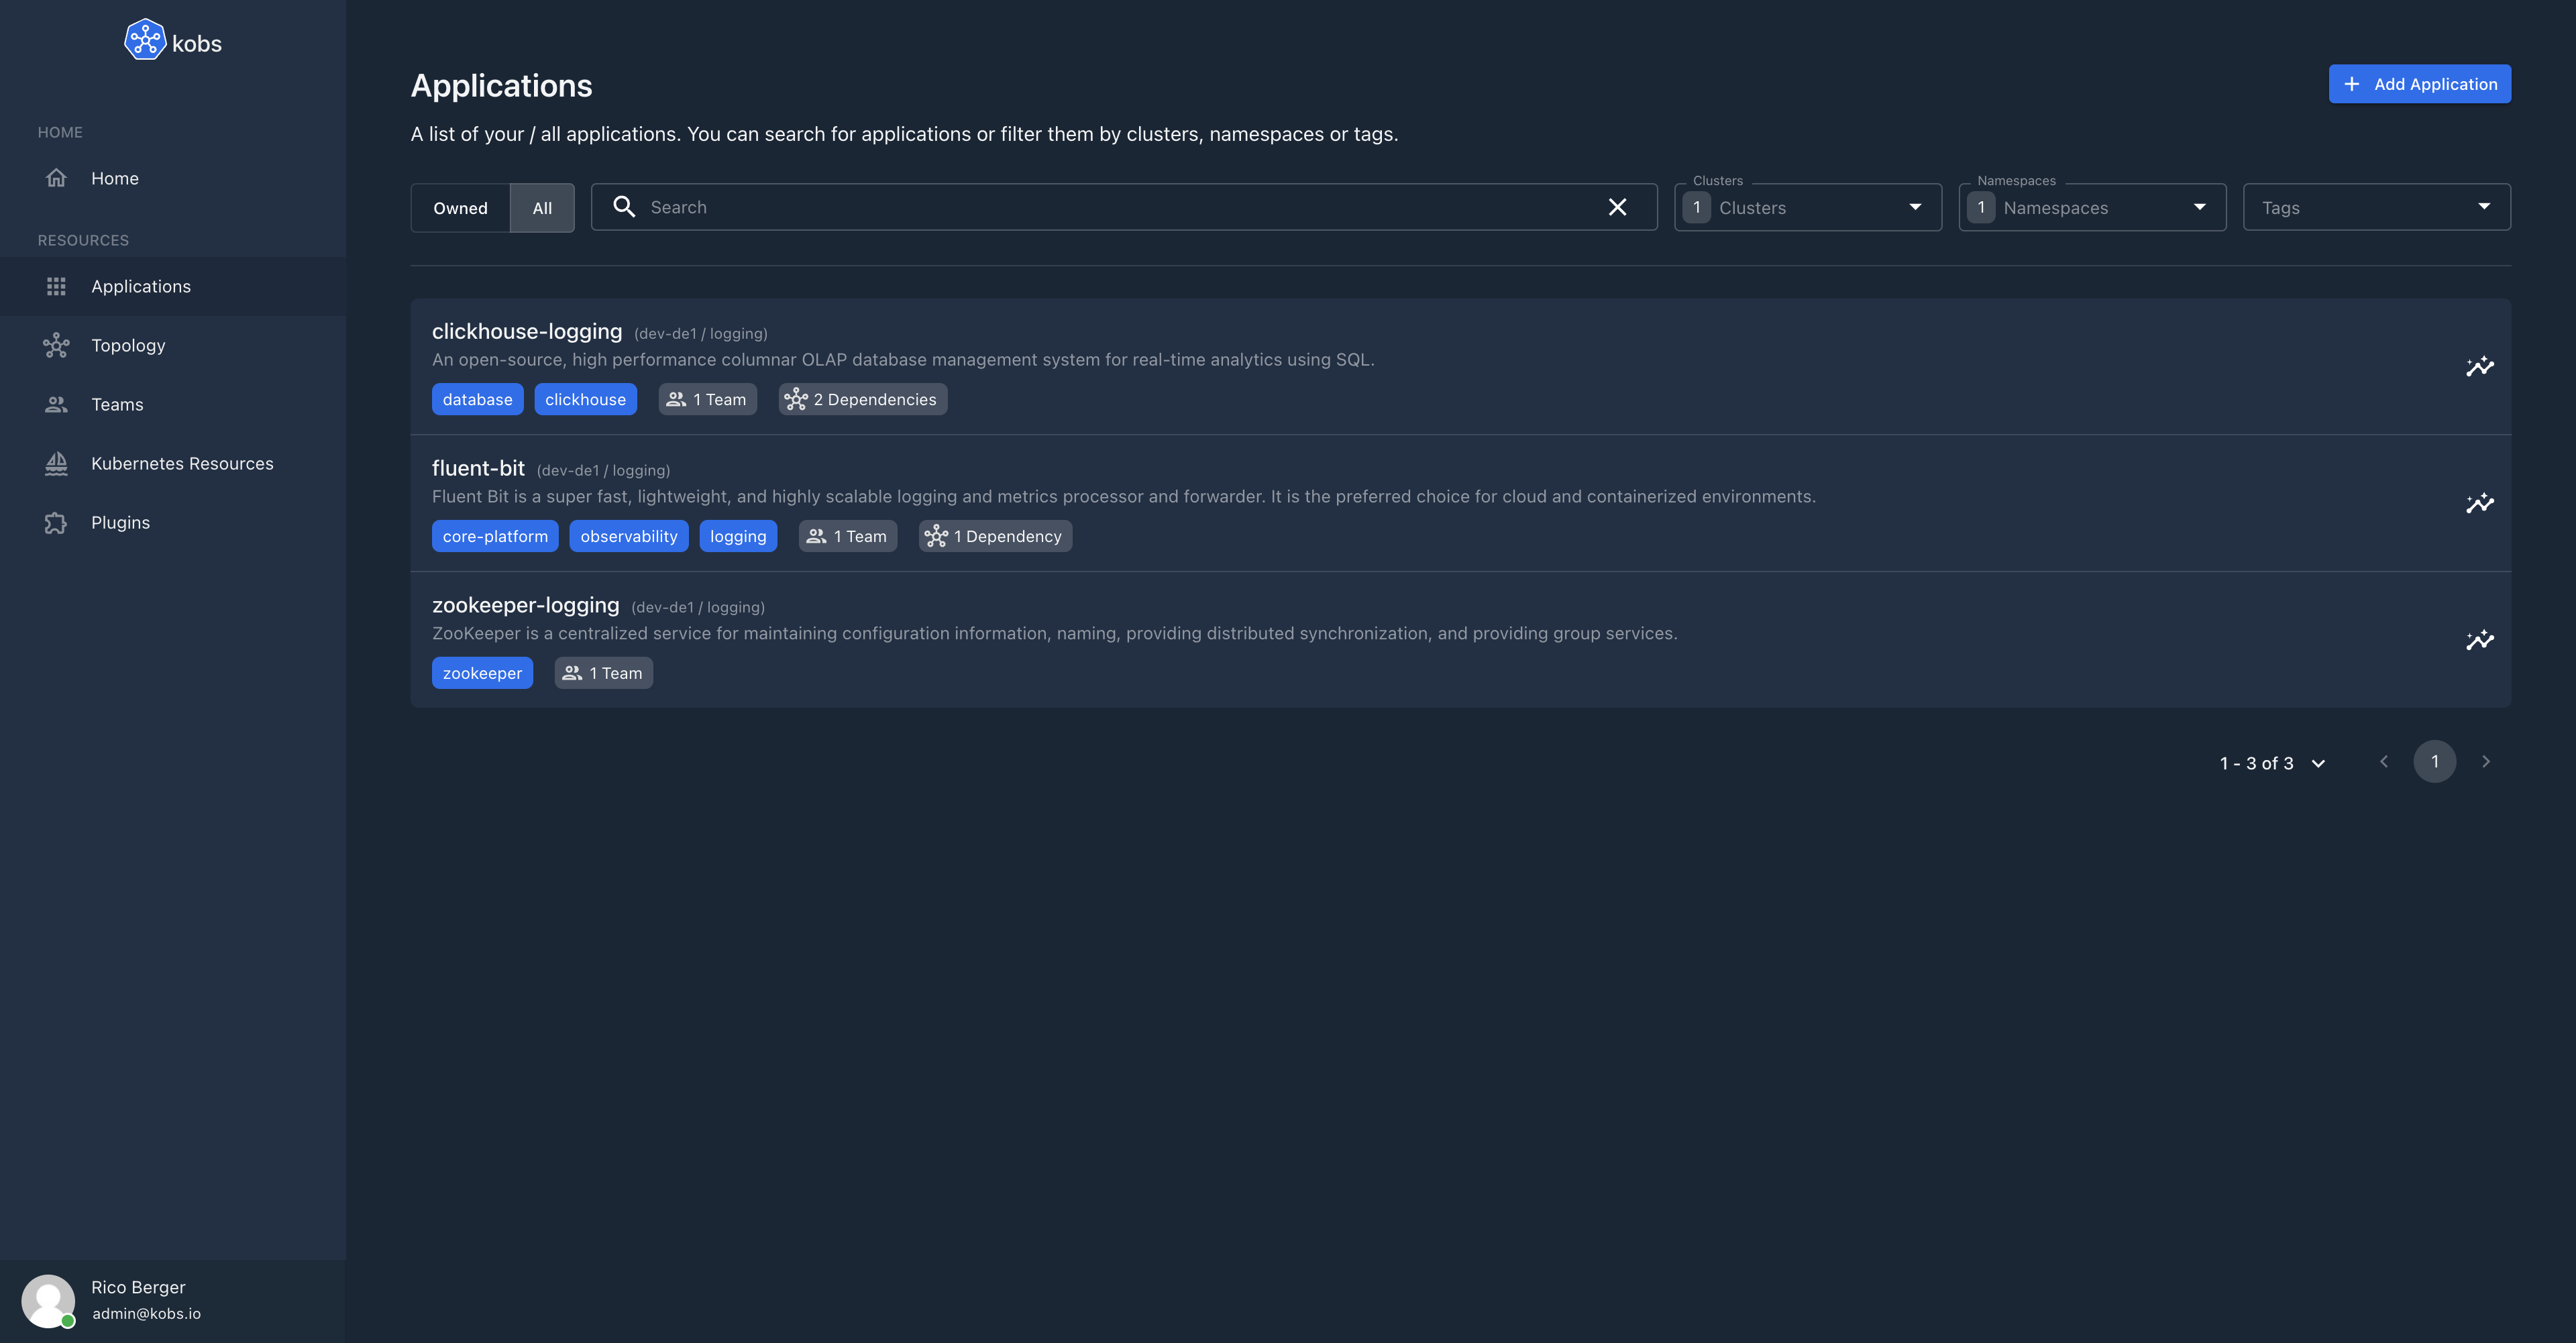
Applications can be accessed via the Applications page. By default it shows all the Applications, which are owned by a Team a User is part of. It is also possible to filter the list of Applications by clusters, namespaces, tags or search for them by their name.
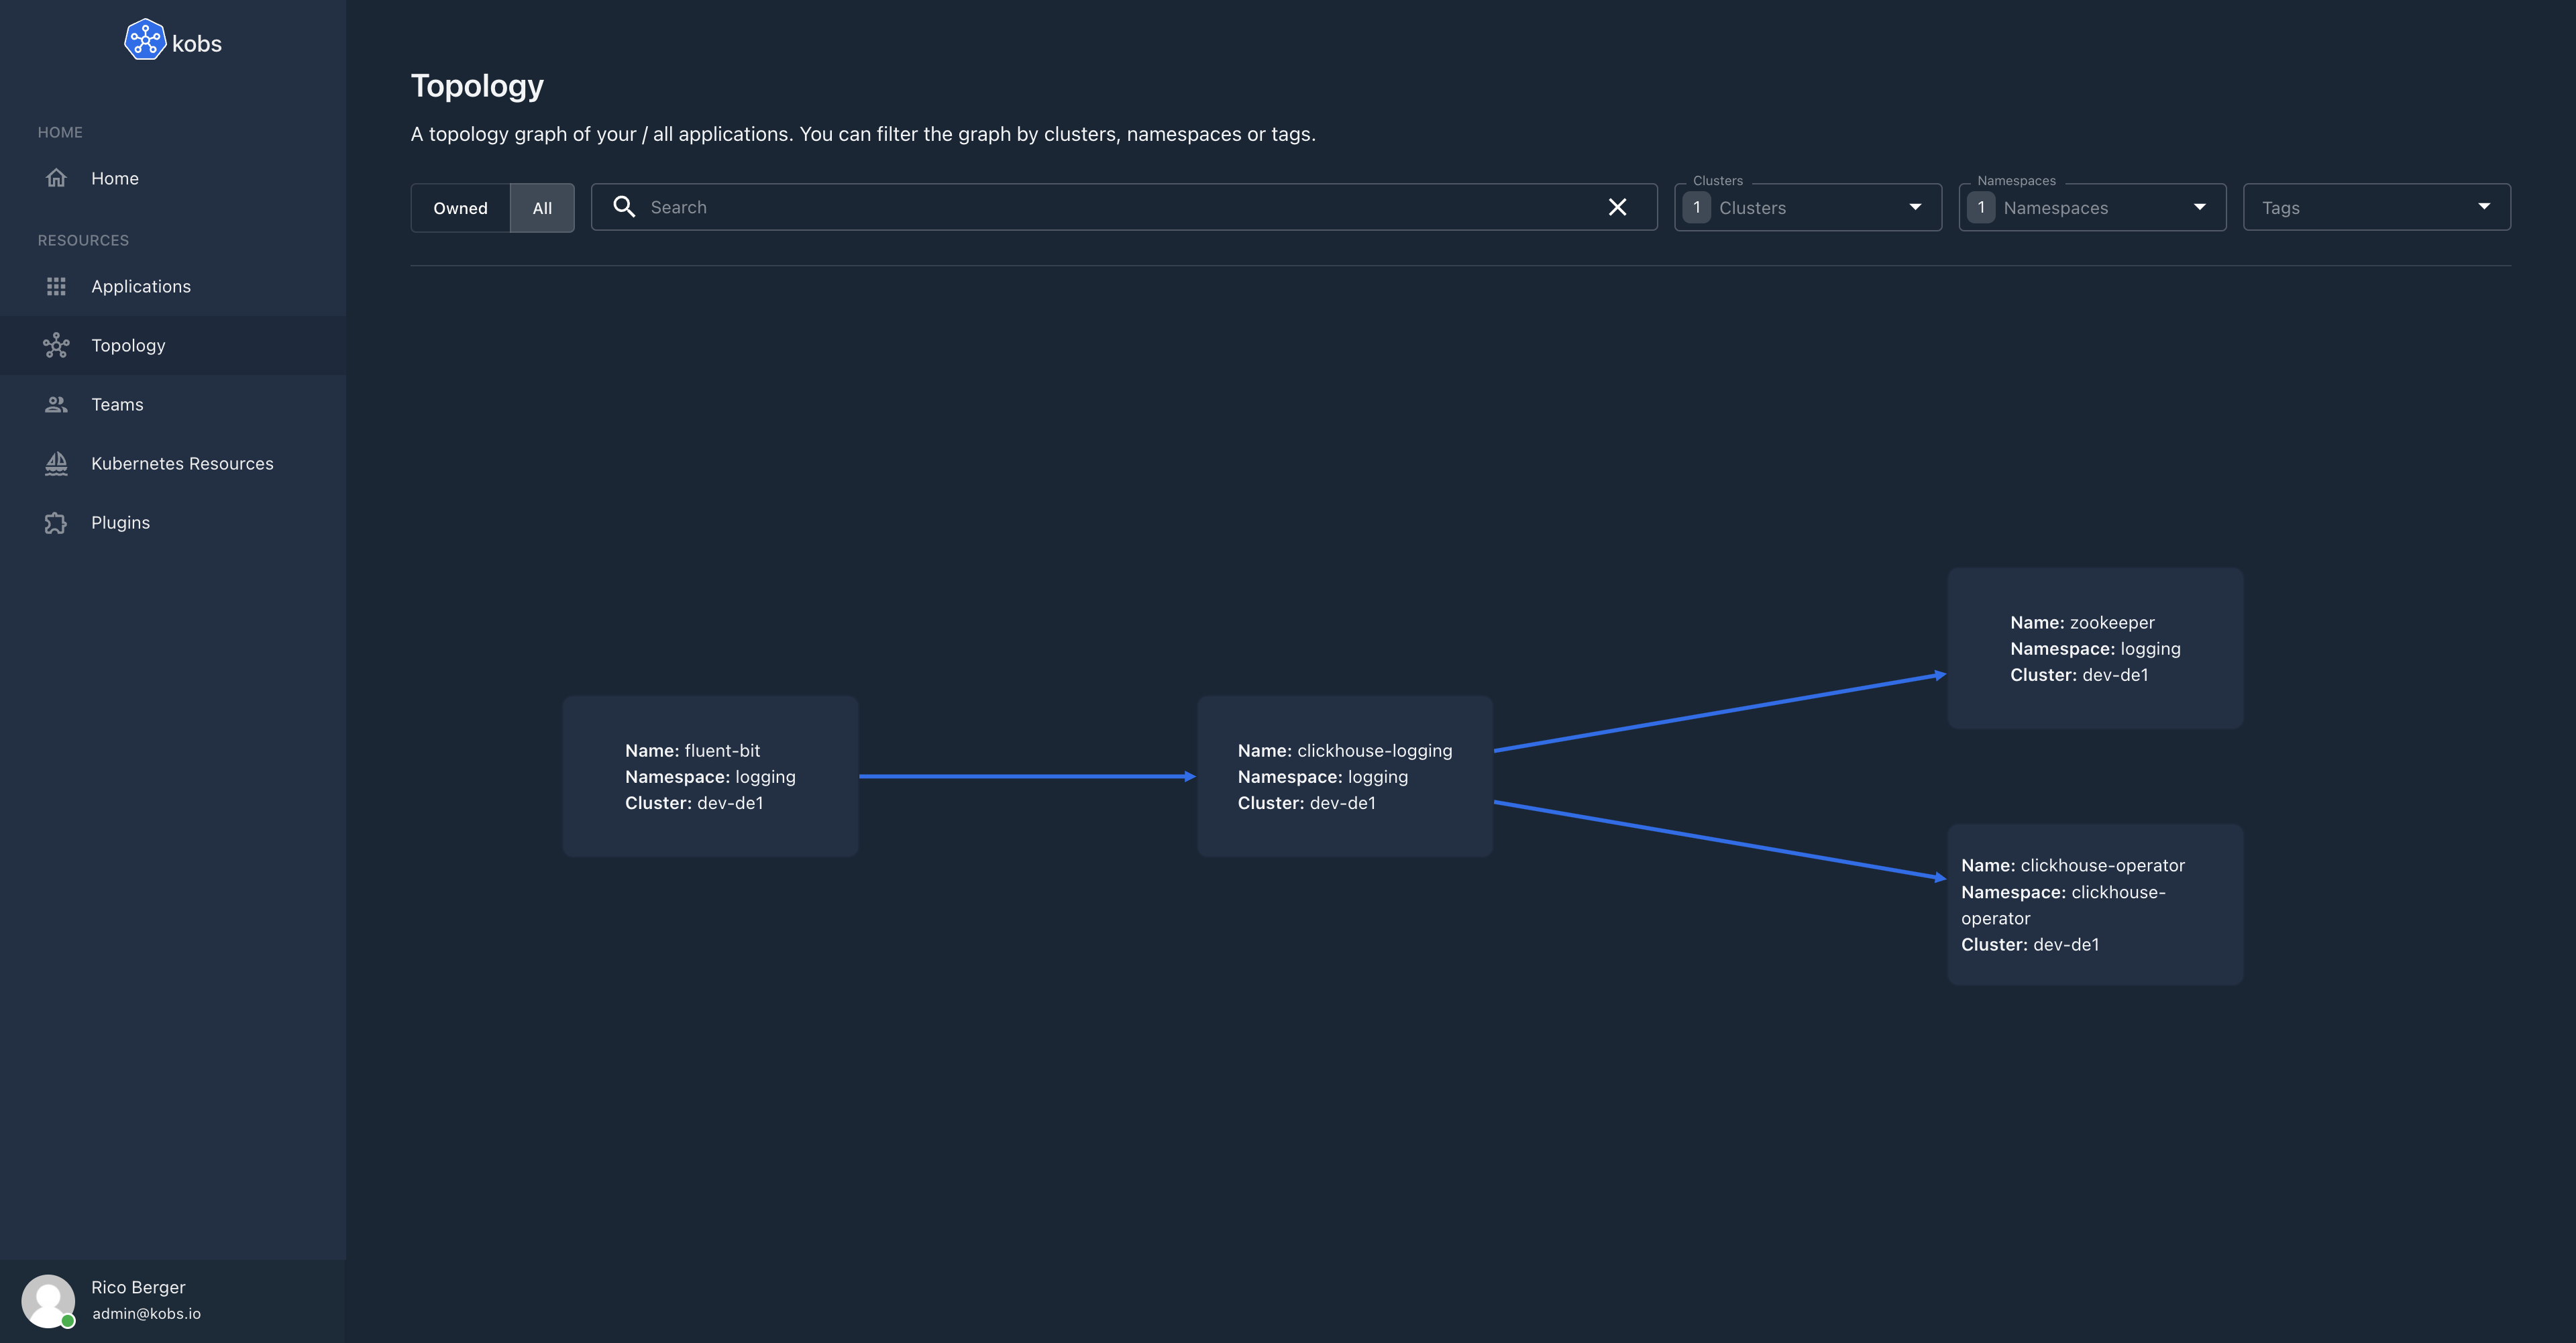
You can also use the topology page to view the topology graph of your applications. For that you can use the topology.dependencies field in the Application CR to define the dependencies for an Application.
Specification
| Field | Type | Description | Required |
|---|---|---|---|
| description | string | Provide a descriptions for the application with additional details. | No |
| tags | []string | A list of tags to describe the application. | No |
| links | []Link | A list of links (e.g. a link to the GitHub repository for this application). | No |
| teams | []string | A list of teams to define the ownership for the application. The provided names must match a group field in a defined Team CR. |
No |
| topology | Topology | Set the topology settings for your application. This can be used to define dependencies or to add Application which are running outside of Kubernetes. | No |
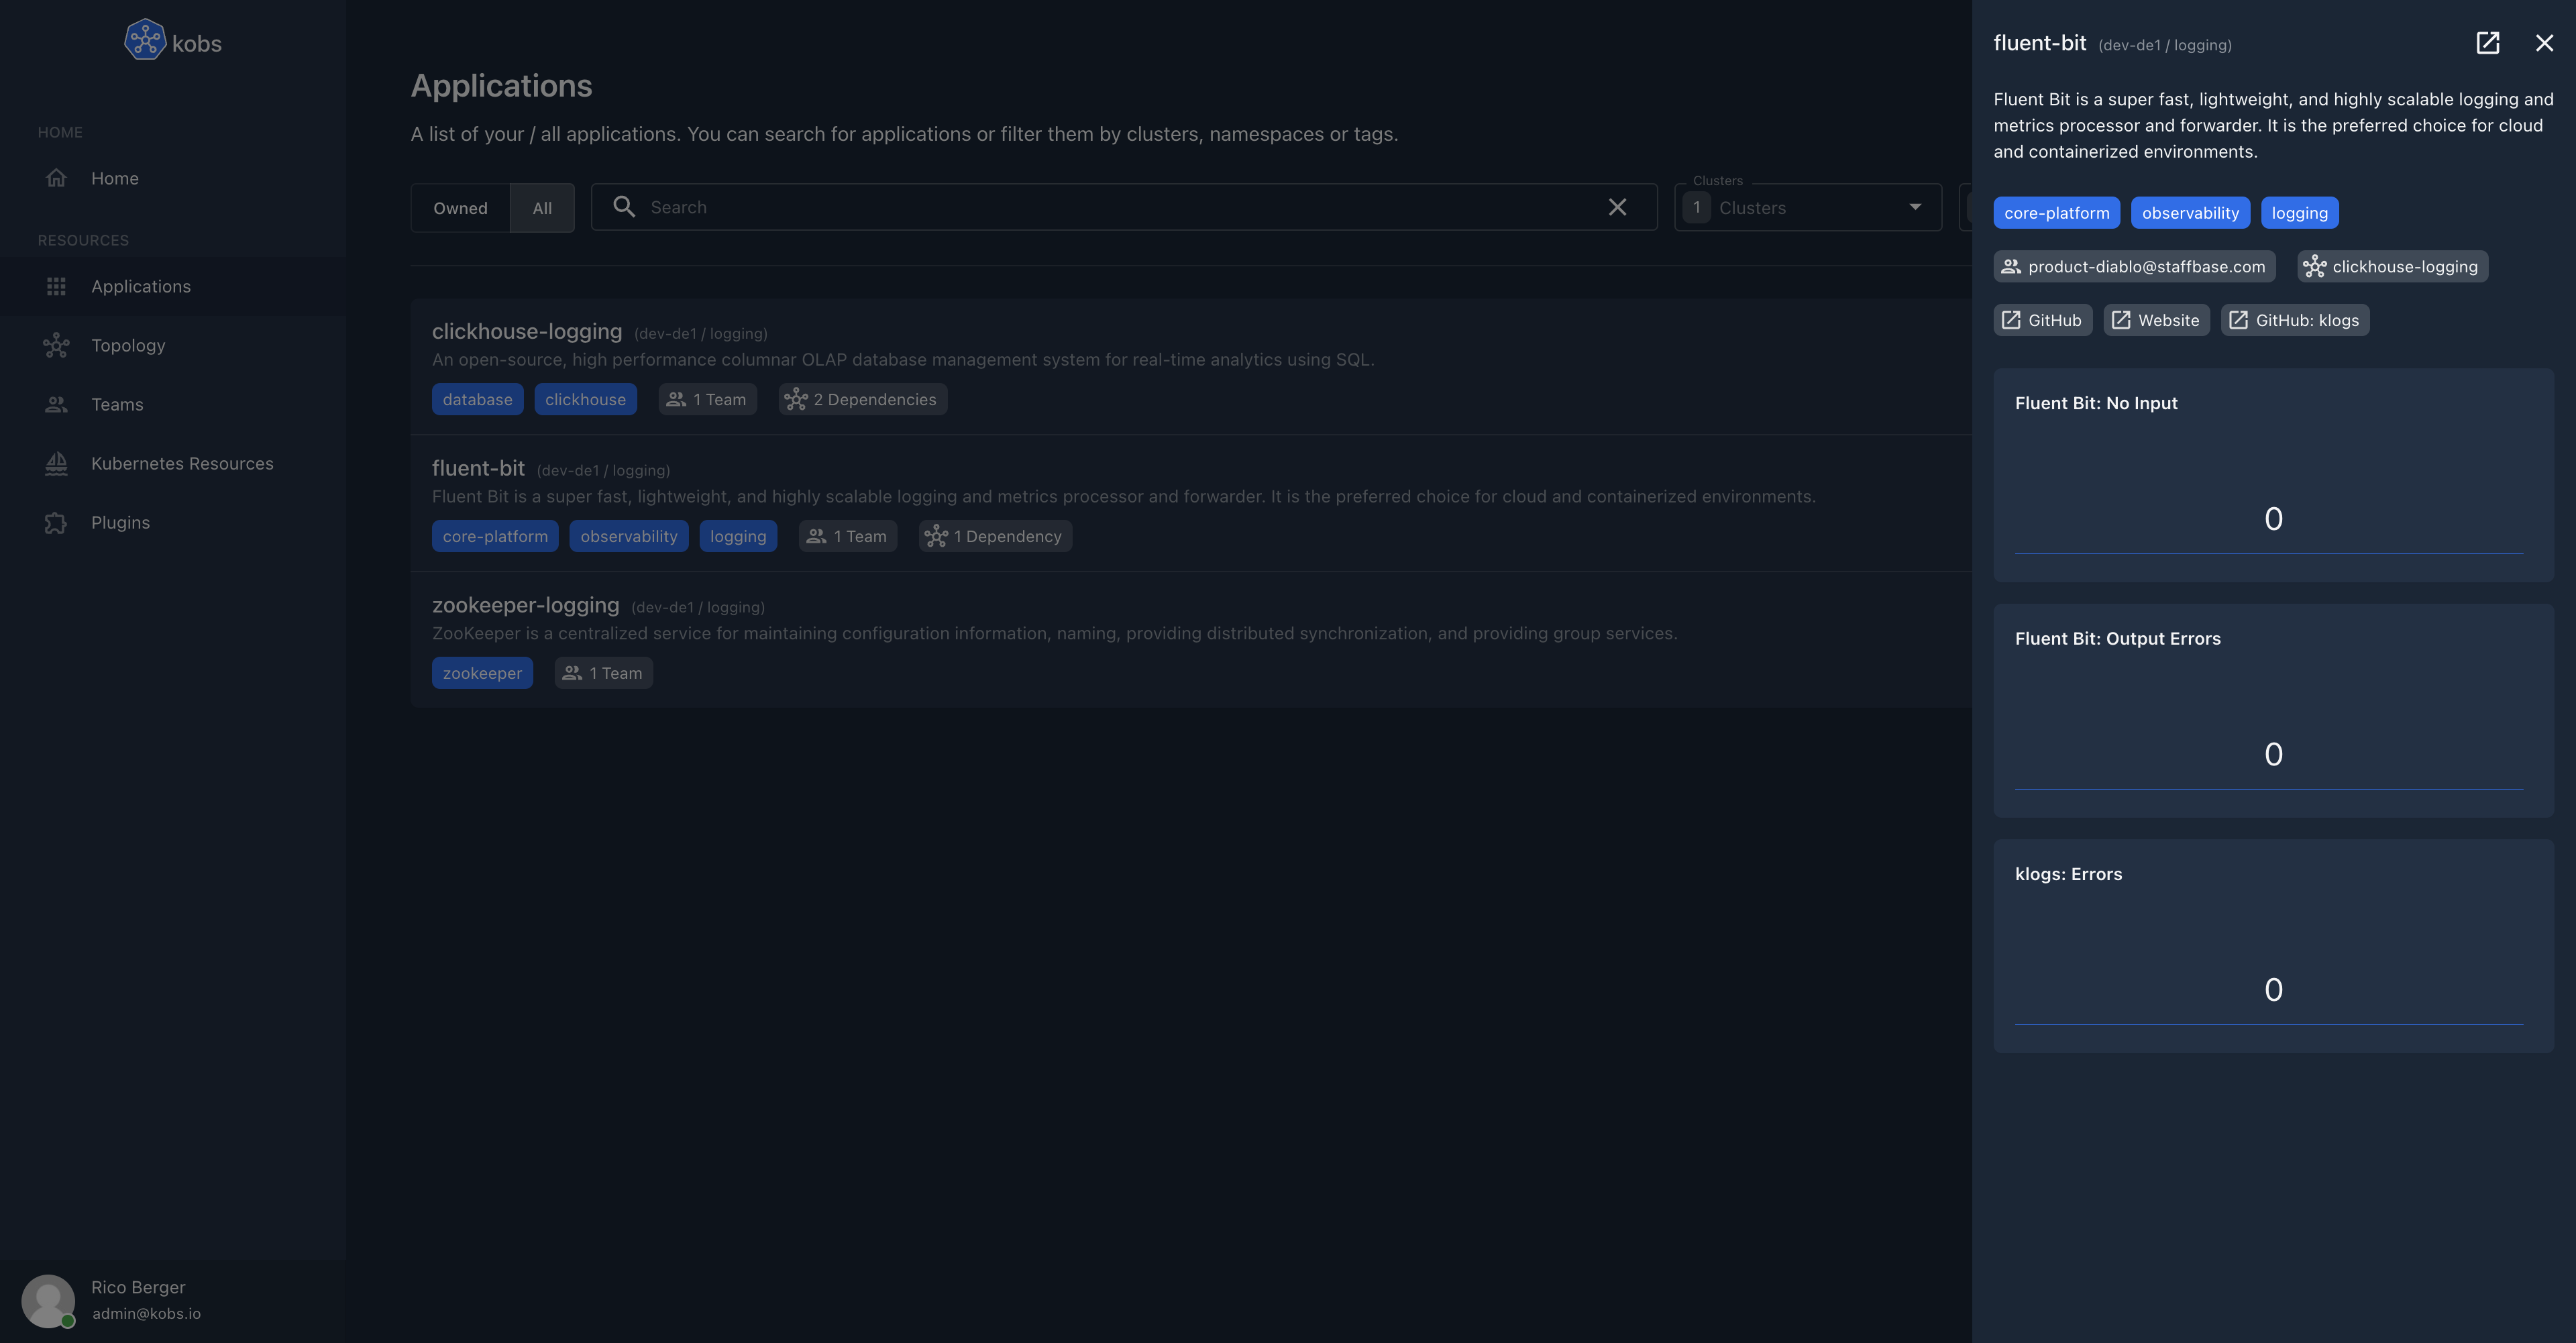
| insights | []Insight | A list of insights for an Application, e.g. the most important metrics. | No |
| dashboards | []Dashboard | A list of dashboards, which should be shown for this application. | No |
Link
| Field | Type | Description | Required |
|---|---|---|---|
| title | string | Title for the link | Yes |
| link | string | The actuall link | Yes |
Topology
| Field | Type | Description | Required |
|---|---|---|---|
| external | boolean | When this true the application will be marked as external. This means that we do not show the cluster and namespace of the Application CR in the UI, to allow users to also add Applications which are not running in a Kubernetes cluster. |
No |
| dependencies | []Dependency | Add other applications as dependencies for this application. This can be used to render a topology graph for your applications. | No |
Dependency
| Field | Type | Description | Required |
|---|---|---|---|
| cluster | string | Cluster of the application, which should be added as dependency. If this field is omitted kobs will look in the same cluster as the application was created in. | No |
| namespace | string | Namespace of the application, which should be added as dependency. If this field is omitted kobs will look in the same namespace as the application was created in. | No |
| name | string | Name of the application, which should be added as dependency. | Yes |
| description | string | The description can be used to explain, why this application is a dependency of the current application. | No |
Insight
| Field | Type | Description | Required |
|---|---|---|---|
| title | string | The title for the defined insight metric. | Yes |
| type | string | The type which should be used to display the insight metric. Currently the only valid value is sparkline. |
Yes |
| unit | string | An optional unit for the metric. | No |
| mappings | map |
A map of mappings, which should be displayed instead of the current metric value. | No |
| plugin | Plugin | The plugin, which should be used for the preview. | Yes |
Dashboard
Define the dashboards, which should be used for the application.
| Field | Type | Description | Required |
|---|---|---|---|
| cluster | string | Cluster of the dashboard. If this field is omitted kobs will look in the same cluster as the application was created in. | No |
| namespace | string | Namespace of the dashboard. If this field is omitted kobs will look in the same namespace as the application was created in. | No |
| name | string | Name of the dashboard. Note: You have not to provide a name, if you use the inline property. | Yes |
| title | string | Title for the dashboard | Yes |
| description | string | The description can be used to explain the content of the dashboard. | No |
| placeholders | map |
A map of placeholders, whith the name as key and the value for the placeholder as value. More information for placeholders can be found in the documentation for Dashboards. | No |
| inline | Inline | Specify a complete dashboard within the reference. This can be used if you just use the dashboard within one application. | No |
Inline
| Field | Type | Description | Required |
|---|---|---|---|
| hideToolbar | boolean | If this is true the toolbar will be hidden in the dashboard. |
No |
| defaultTime | boolean | Set the default time interval used for a dashboard. Must be last12Hours, last15Minutes, last1Day, last1Hour, last1Year, last2Days, last30Days, last30Minutes, last3Hours, last5Minutes, last6Hours, last6Months, last7Days or last90Days. The default value is last15Minutes. |
No |
| variables | []Variable | A list of variables, where the values are loaded by the specified plugin. | No |
| rows | []Row | A list of rows for the dashboard. | Yes |
Example
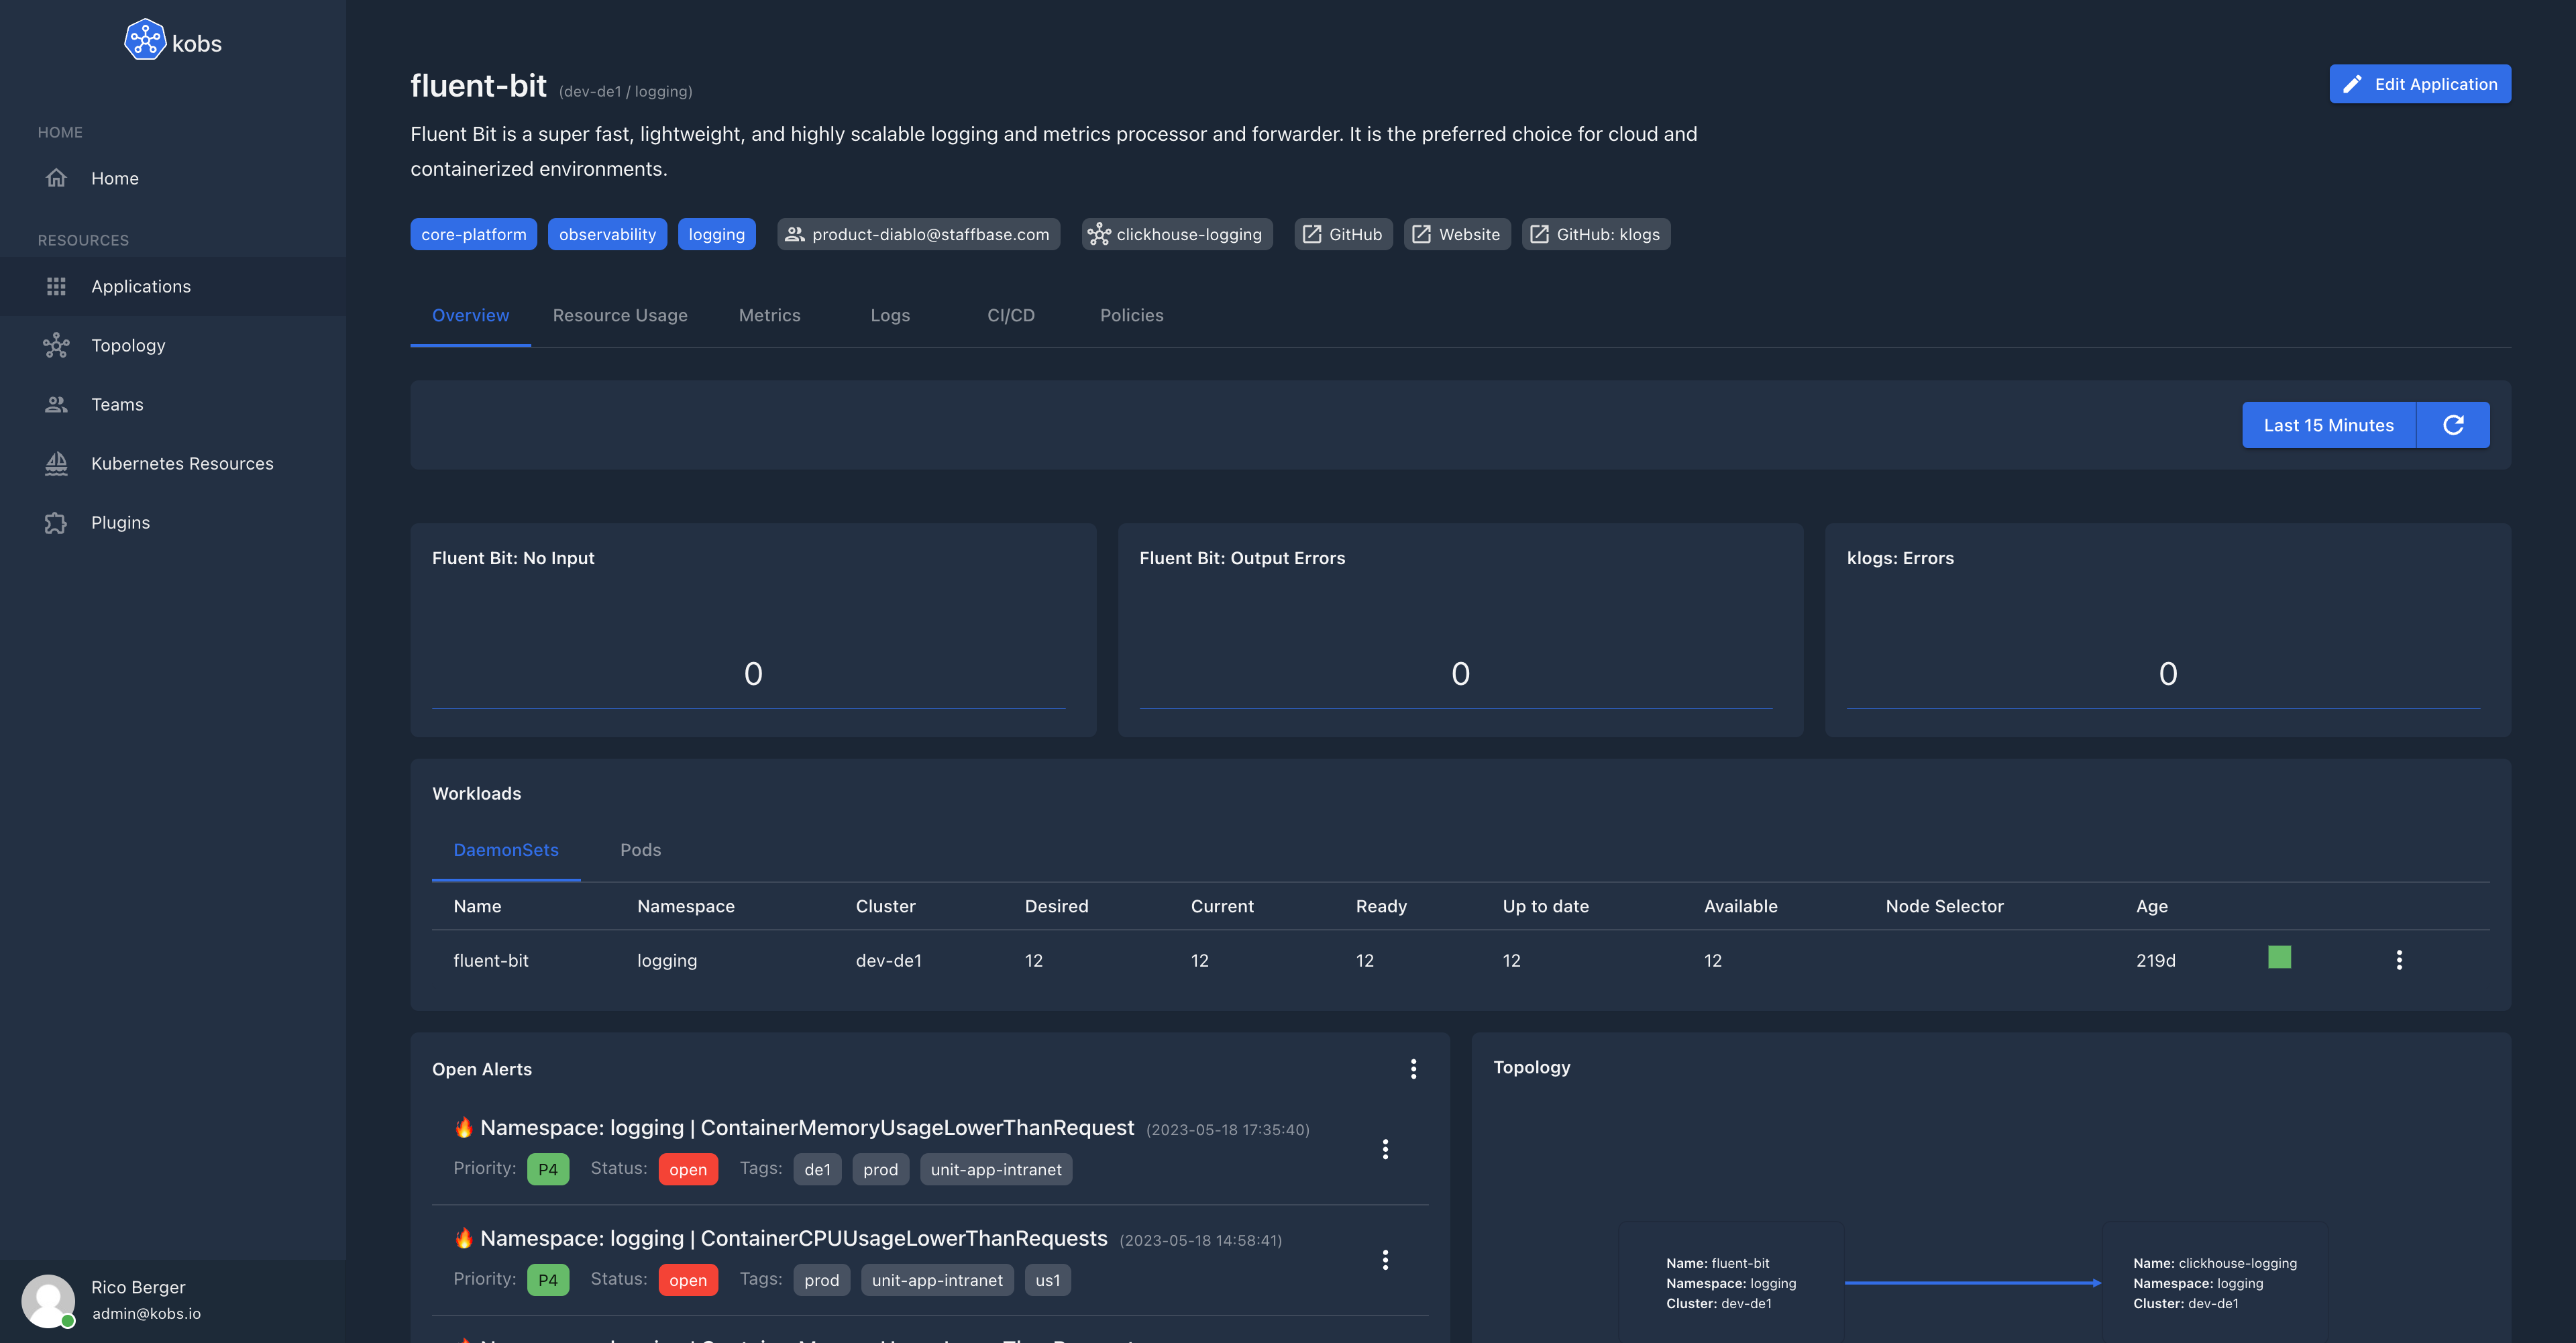
The following Application CR defines an kobs Application for Fluent Bit, to display, the resources, metrics and logs for Fluent Bit.
Application
---
apiVersion: kobs.io/v1
kind: Application
metadata:
name: fluent-bit
namespace: logging
spec:
description: Fluent Bit is a super fast, lightweight, and highly scalable logging and metrics processor and forwarder. It is the preferred choice for cloud and containerized environments.
tags:
- core-platform
- observability
- logging
links:
- title: GitHub
link: https://github.com/fluent/fluent-bit
- title: Website
link: https://fluentbit.io
- title: "GitHub: klogs"
link: https://github.com/kobsio/klogs
teams:
- product-diablo@staffbase.com
topology:
dependencies:
- name: clickhouse-logging
insights:
- title: "Fluent Bit: No Input"
type: sparkline
plugin:
name: prometheus
type: prometheus
options:
query: count(sum(rate(fluentbit_input_bytes_total{namespace="logging", pod=~"fluent-bit-.*", name="tail.0"}[5m])) by (pod, name) == 0) or vector(0)
- title: "Fluent Bit: Output Errors"
type: sparkline
plugin:
name: prometheus
type: prometheus
options:
query: sum(rate(fluentbit_output_errors_total[1m]))
- title: "klogs: Errors"
type: sparkline
plugin:
name: prometheus
type: prometheus
options:
query: sum(rate(klogs_errors_total{namespace="logging", pod=~"fluent-bit-.*"}[5m]))
dashboards:
- namespace: kobs
name: overview
title: Overview
placeholders:
cluster: "<% $.cluster %>"
namespace: "<% $.namespace %>"
name: "<% $.name %>"
resources: |
- pods
- daemonsets
param: app=<% $.name %>
- namespace: kobs
name: resource-usage
title: Resource Usage
placeholders:
namespace: "<% $.namespace %>"
pod: "<% $.name %>-.*"
verticalpodautoscaler: "<% $.name %>"
- title: Metrics
inline:
rows:
- panels:
- title: Fluent Bits
plugin:
type: prometheus
name: prometheus
options:
queries:
- query: >-
sum(kube_pod_info{namespace="logging",
pod=~"fluent-bit-.*"})
type: sparkline
h: 4
w: 6
x: 0
'y': 0
- title: Ready Nodes
plugin:
type: prometheus
name: prometheus
options:
queries:
- query: >-
sum(kube_node_status_condition{condition="Ready",status="true"})
type: sparkline
h: 4
w: 6
x: 6
'y': 0
- title: Input / Output Diff
plugin:
type: prometheus
name: prometheus
options:
queries:
- label: Input / Output Diff
query: >-
abs(sum(rate(fluentbit_input_records_total{namespace="logging",
pod=~"fluent-bit-.*"}[5m])) -
sum(rate(klogs_batch_size_sum{namespace="logging",
pod=~"fluent-bit-.*"}[5m])))
stacked: true
type: area
h: 4
w: 12
x: 0
'y': 4
- title: Fluent Bit
panels:
- title: Input Bytes Processing Rate
plugin:
type: prometheus
name: prometheus
options:
legend: table
queries:
- label: '{% .name %}'
query: >-
sum(rate(fluentbit_input_bytes_total{namespace="logging",
pod=~"fluent-bit-.*"}[5m])) by (name) / 1024 / 1024
stacked: true
type: area
unit: MiB/s
h: 9
w: 6
x: 0
'y': 0
- title: Output Bytes Processing Rate
plugin:
type: prometheus
name: prometheus
options:
legend: table
queries:
- label: '{% .name %}'
query: >-
sum(rate(fluentbit_output_proc_bytes_total{namespace="logging",
pod=~"fluent-bit-.*"}[5m])) by (name) / 1024 / 1024
stacked: true
type: area
unit: MiB/s
h: 9
w: 6
x: 6
'y': 0
- title: Input Records Processing Rate
plugin:
type: prometheus
name: prometheus
options:
legend: table
queries:
- label: '{% .name %}'
query: >-
sum(rate(fluentbit_input_records_total{namespace="logging",
pod=~"fluent-bit-.*"}[5m])) by (name)
stacked: true
type: area
unit: rps
h: 9
w: 6
x: 0
'y': 9
- title: Output Record Processing Rate
plugin:
type: prometheus
name: prometheus
options:
legend: table
queries:
- label: '{% .name %}'
query: >-
sum(rate(fluentbit_output_proc_records_total{namespace="logging",
pod=~"fluent-bit-.*"}[5m])) by (name)
stacked: true
type: area
unit: rps
h: 9
w: 6
x: 6
'y': 9
- title: Output Retry/Failed-Rytry Rate
plugin:
type: prometheus
name: prometheus
options:
legend: table
queries:
- label: Retries to {% .name %}
query: >-
sum(rate(fluentbit_output_retries_total{namespace="logging",
pod=~"fluent-bit-.*"}[5m])) by (name)
- label: Failed Retries to {% .name %}
query: >-
sum(rate(fluentbit_output_retries_failed_total{namespace="logging",
pod=~"fluent-bit-.*"}[5m])) by (name)
stacked: true
type: area
h: 9
w: 6
x: 0
'y': 18
- title: Output Error Rate
plugin:
type: prometheus
name: prometheus
options:
legend: table
queries:
- label: '{% .name %}'
query: >-
sum(rate(fluentbit_output_errors_total{namespace="logging",
pod=~"fluent-bit-.*"}[5m])) by (name)
stacked: true
type: area
h: 9
w: 6
x: 6
'y': 18
- title: klogs
panels:
- title: Input Records Processing Rate
plugin:
type: prometheus
name: prometheus
options:
legend: table
queries:
- label: Input Rate
query: >-
sum(rate(klogs_input_records_total{namespace="logging",
pod=~"fluent-bit-.*"}[5m]))
stacked: true
type: area
unit: rps
h: 9
w: 6
x: 0
'y': 0
- title: Output Record Processing Rate
plugin:
type: prometheus
name: prometheus
options:
legend: table
queries:
- label: Output Rate
query: >-
sum(rate(klogs_batch_size_sum{namespace="logging",
pod=~"fluent-bit-.*"}[5m]))
stacked: true
type: area
unit: rps
h: 9
w: 6
x: 6
'y': 0
- title: Errors
plugin:
type: prometheus
name: prometheus
options:
legend: table
queries:
- label: Errors
query: >-
sum(rate(klogs_errors_total{namespace="logging",
pod=~"fluent-bit-.*"}[5m]))
stacked: true
type: area
unit: rps
h: 9
w: 6
x: 0
'y': 9
- title: Avg. Flush Time
plugin:
type: prometheus
name: prometheus
options:
legend: table
queries:
- label: Flush Time
query: >-
sum(rate(klogs_flush_time_seconds_sum{namespace="logging",
pod=~"fluent-bit-.*"}[5m])) /
sum(rate(klogs_flush_time_seconds_count{namespace="logging",
pod=~"fluent-bit-.*"}[5m]))
stacked: true
type: area
unit: s
h: 9
w: 6
x: 6
'y': 9
- title: Hosts
autoHeight: true
panels:
- title: Stats
plugin:
type: prometheus
name: prometheus
options:
columns:
- name: instance
title: Host
- name: value-2
title: Fluent Bit Input Records Processing Rate
unit: rps
- name: value-3
title: Fluent Bit Output Records Processing Rate
unit: rps
- name: value-4
title: Fluent Bit Output Error Rate
- name: value-5
title: klogs Input Records Processing Rate
unit: rps
- name: value-6
title: klogs Output Records Processing Rate
unit: rps
- name: value-7
title: klogs Output Error Rate
queries:
- label: '{% .instance %}'
query: sum(node_exporter_build_info) by (instance)
- label: '{% .instance %}'
query: >-
sum(rate(fluentbit_input_records_total{namespace="logging",
pod=~"fluent-bit-.*"}[5m])) by (instance)
- label: '{% .instance %}'
query: >-
sum(rate(fluentbit_output_proc_records_total{namespace="logging",
pod=~"fluent-bit-.*"}[5m])) by (instance)
- label: '{% .instance %}'
query: >-
sum(rate(fluentbit_output_errors_total{namespace="logging",
pod=~"fluent-bit-.*"}[5m])) by (instance)
- label: '{% .instance %}'
query: >-
sum(rate(klogs_input_records_total{namespace="logging",
pod=~"fluent-bit-.*"}[5m])) by (instance)
- label: '{% .instance %}'
query: >-
sum(rate(klogs_batch_size_sum{namespace="logging",
pod=~"fluent-bit-.*"}[5m])) by (instance)
- label: '{% .instance %}'
query: >-
sum(rate(klogs_errors_total{namespace="logging",
pod=~"fluent-bit-.*"}[5m])) by (instance)
type: table
h: 9
w: 12
x: 0
'y': 0
- panels:
- title: Number of Logs
plugin:
type: klogs
name: klogs
options:
aggregation:
chart: bar
horizontalAxisField: host
horizontalAxisLimit: 100
horizontalAxisOperation: top
horizontalAxisOrder: descending
verticalAxisOperation: count
query: namespace!=''
type: aggregation
h: 9
w: 12
x: 0
'y': 0
- namespace: kobs
name: overview-logs
title: Logs
placeholders:
cluster: "<% $.cluster %>"
namespace: "<% $.namespace %>"
name: "<% $.name %>"
queries: |
- name: Fluent Bit Logs
query: "namespace='logging' _and_ app='fluent-bit' _and_ container_name='fluent-bit'"
fields:
- pod_name
- host
- log
- name: klogs Plugin
query: "namespace='logging' _and_ app='fluent-bit' _and_ container_name='fluent-bit' _and_ _exists_ content_caller"
fields:
- pod_name
- host
- log
- name: Fluent Bit Error, Warning and Fatal Logs
query: "namespace='logging' _and_ app='fluent-bit' _and_ container_name='fluent-bit' _and_ (log=~'%warn%' _or_ log=~'%error%' _or_ log=~'%fatal%')"
fields:
- pod_name
- host
- log
- namespace: kobs
name: overview-cicd
title: CI/CD
placeholders:
cluster: "<% $.cluster %>"
namespace: "<% $.namespace %>"
name: "<% $.name %>"
container: "<% $.name %>"
type: daemonset
- namespace: kobs
name: kyverno-policies
title: Policies
placeholders:
namespace: <% $.namespace %>
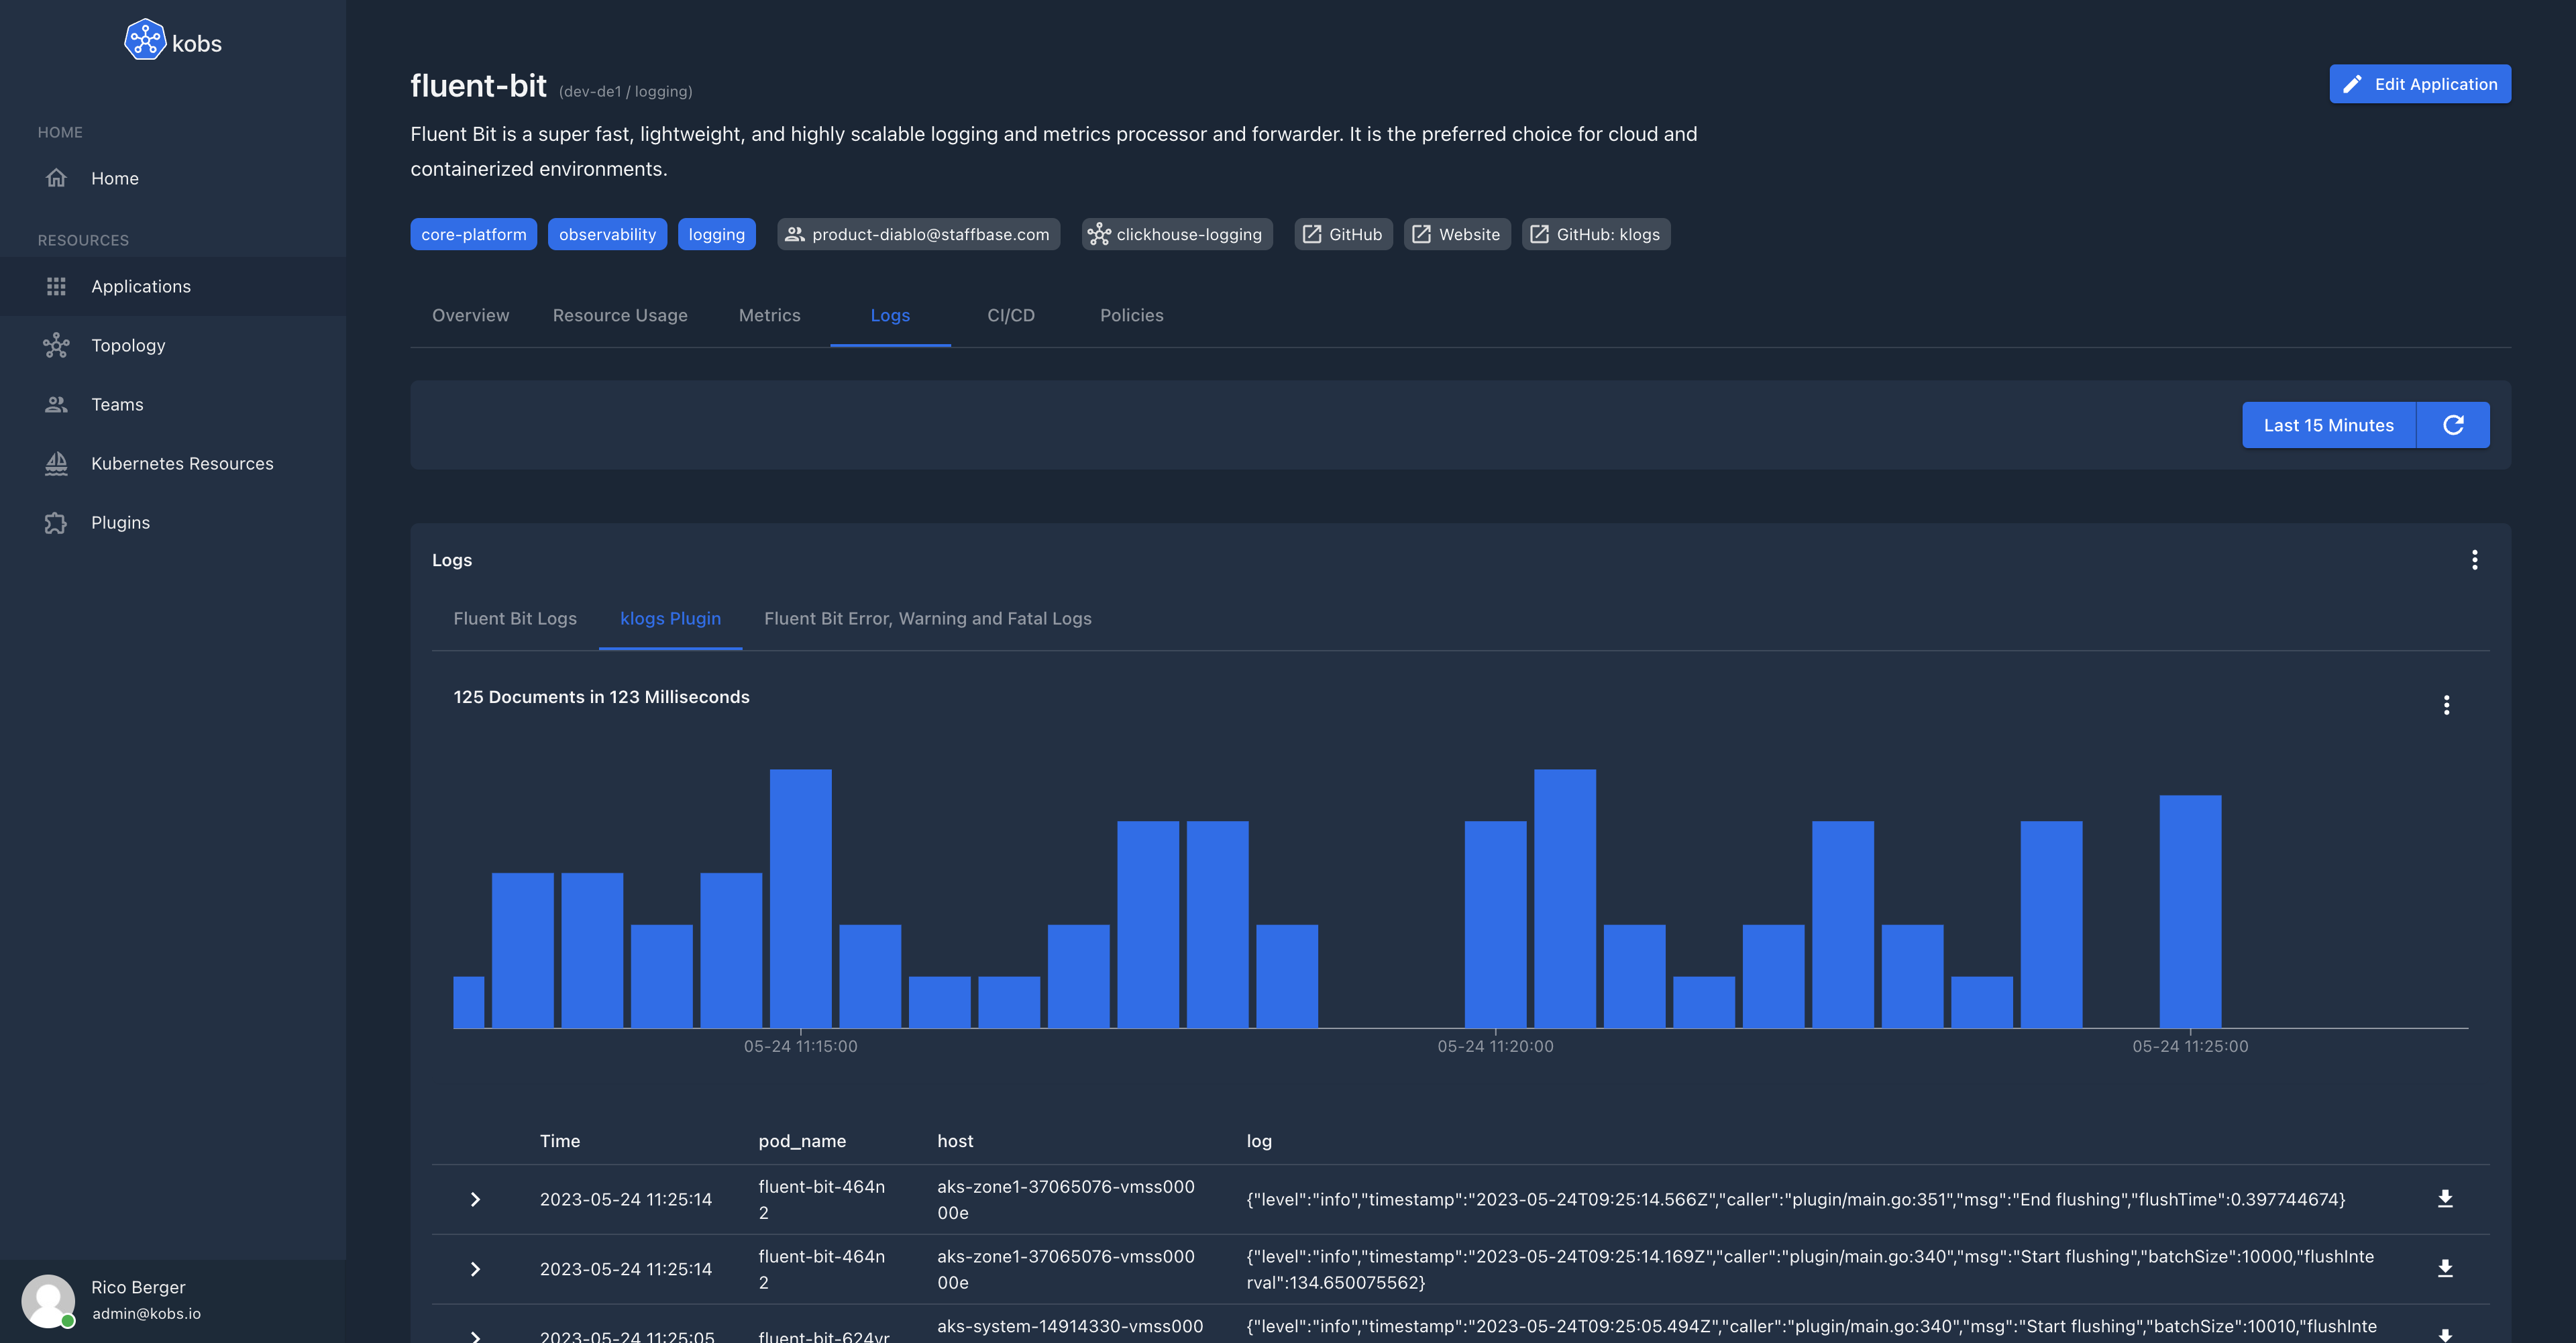
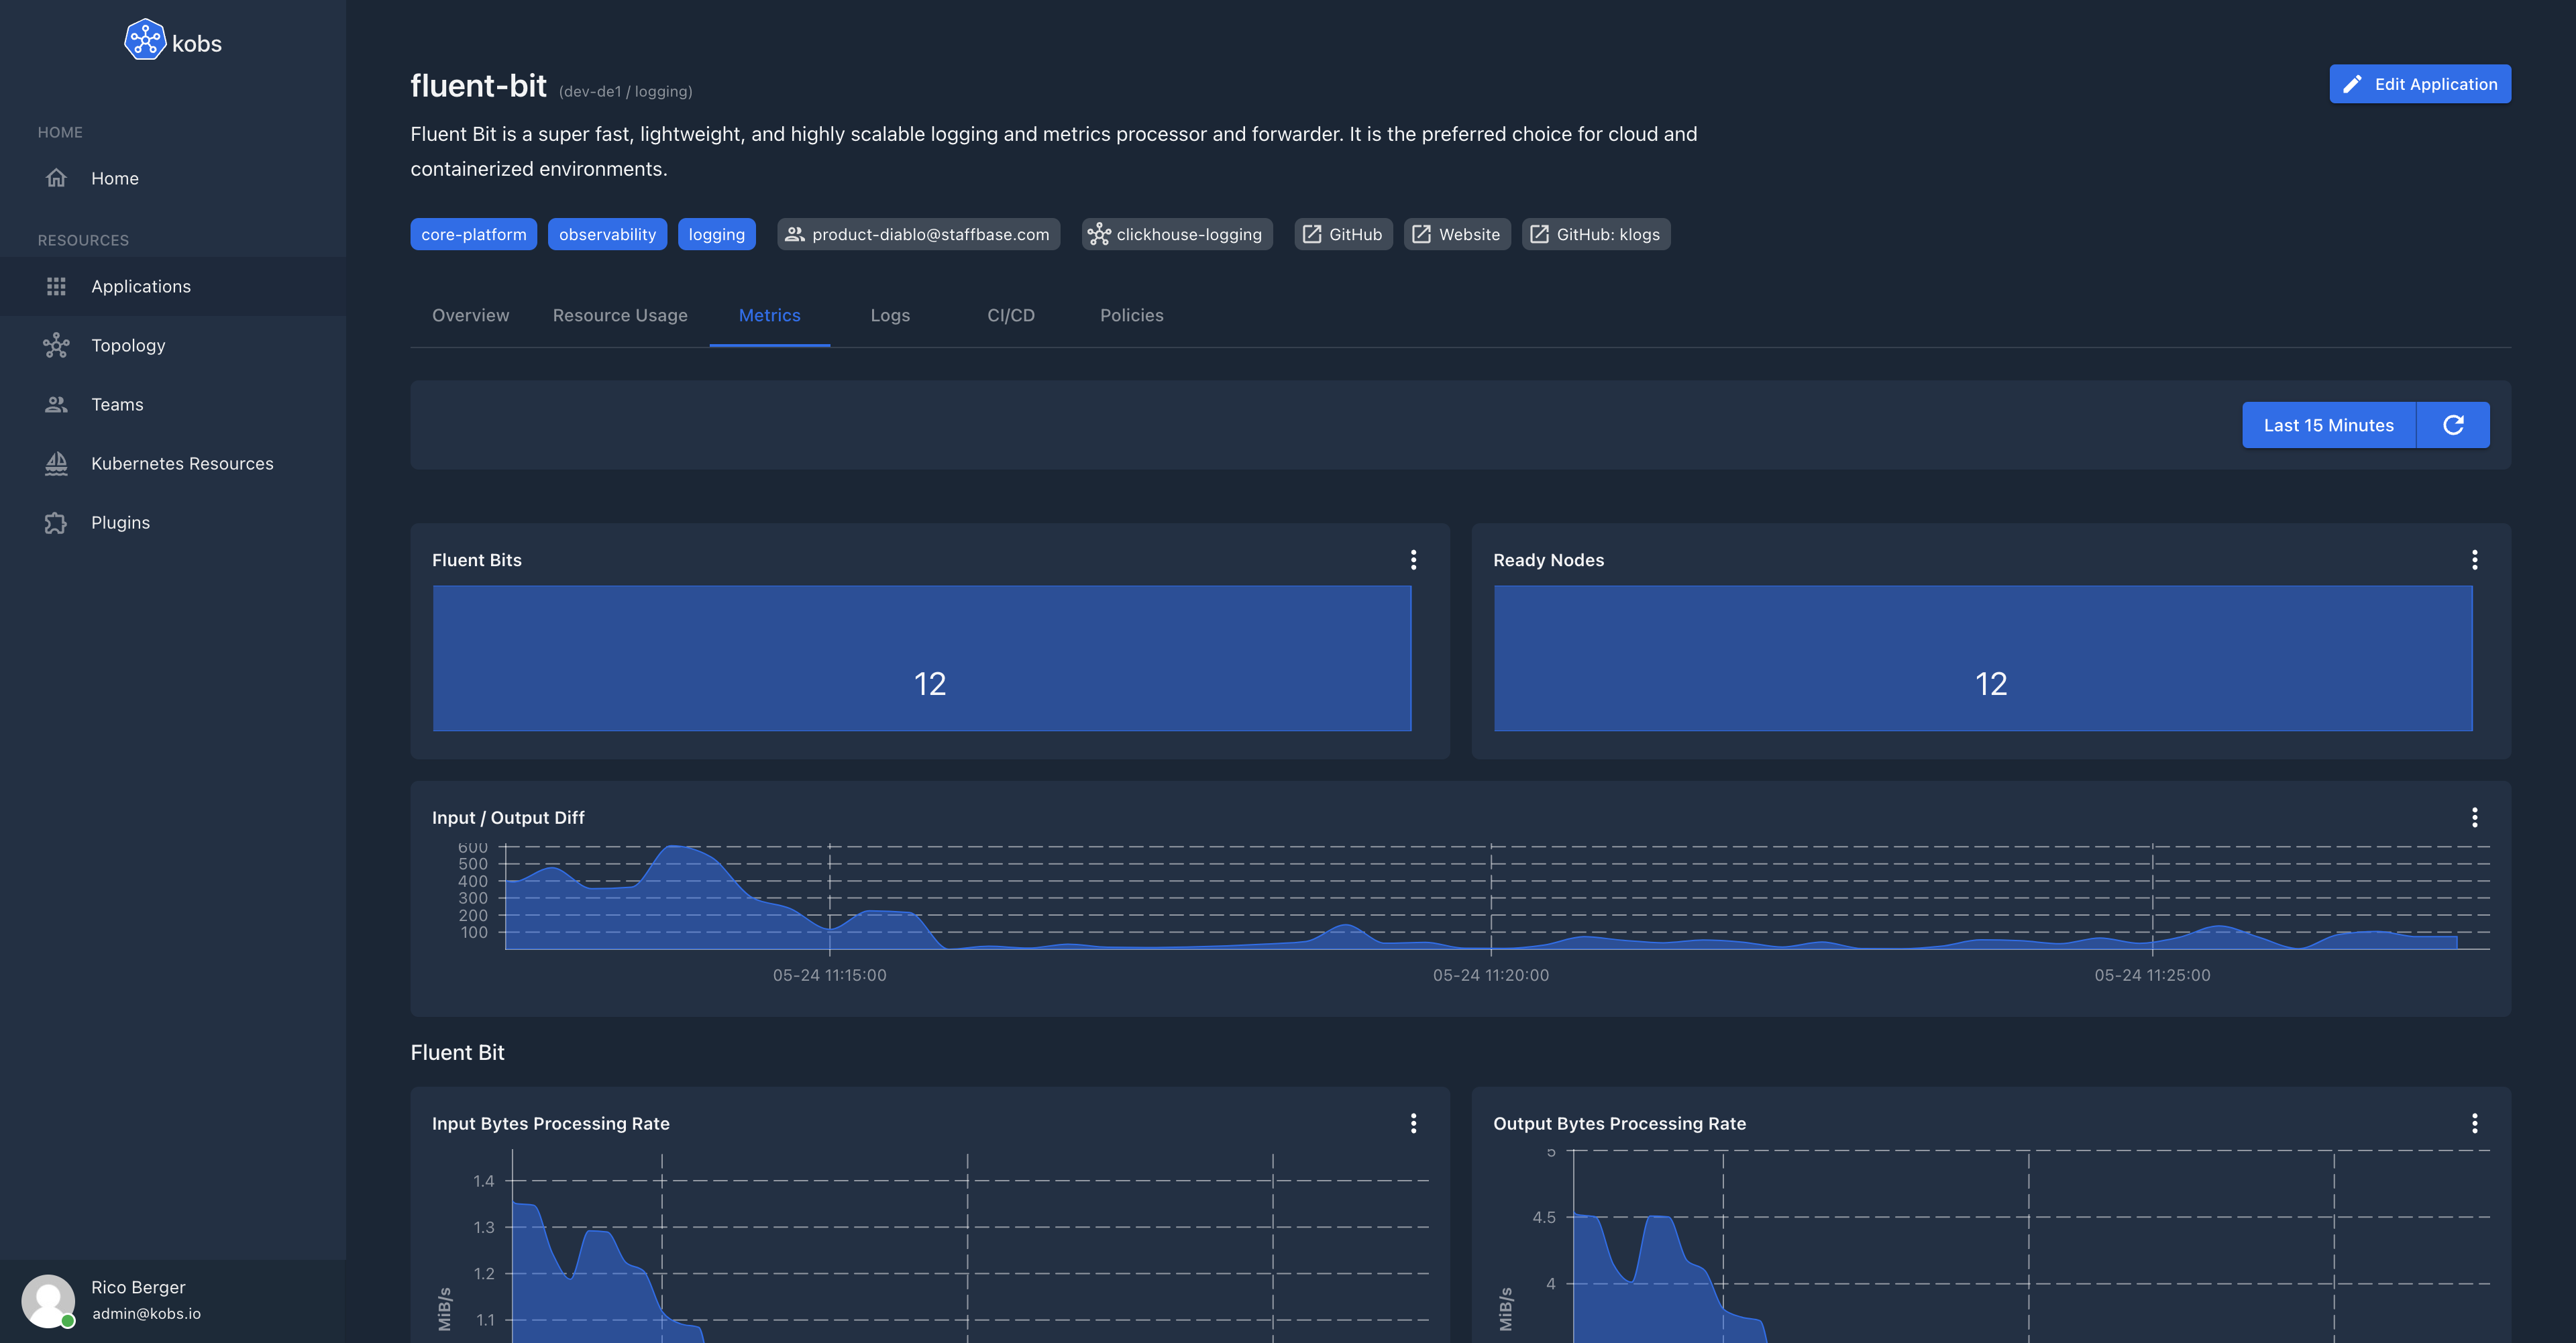
In the fowlling you can find some screenshots how the above application will look in kobs. The application contains the DaemonSet and Pods, which are related to Fluent Bit. It also uses the Prometheus plugin to display metrics and the klogs plugin to display the logs.
Overview
Metrics
Logs