SQL
The SQL plugin can be used to get run queries against a SQL database. Currently we are supporting ClickHouse, Postgres and MySQL databases.
Configuration
To use the SQL plugin the following configuration is needed in the satellites configuration file:
| Field | Type | Description | Required |
|---|---|---|---|
| name | string | The name of the SQL plugin instance. | Yes |
| type | sql |
The type for the SQL plugin. | Yes |
| options.connection | string | The connection string, to connect to a SQL database. | Yes |
| options.driver | string | The driver which should be used for the database instance. This must be clickhouse, postgres or mysql. |
Yes |
plugins:
  - name: sql
    type: sql
    options:
      connection:
      driver:
Insight Options
Note
The SQL plugin can not be used within the insights section of an application.
Variable Options
Note
The SQL plugin can not be used to get a list of variable values.
Panel Options
The following options can be used for a panel with the SQL plugin:
| Field | Type | Description | Required |
|---|---|---|---|
| type | string | The type which should be used to visualize the data. This can be table or chart. |
Yes |
| queries | []Query | A list of queries, which can be selected by the user. This is required when the type is set to table. |
No |
| chart | Chart | Settings to render the results of a query in a chart. This is required when the type is set to chart. |
No |
Query
| Field | Type | Description | Required |
|---|---|---|---|
| name | string | A name for the SQL query, which is displayed in the select box. | Yes |
| query | string | The query which should be run against the configured SQL database. | Yes |
| columns | map |
A map of columns to format the returned data for a query. The key must match the returned column name. | No |
Column
| Field | Type | Description | Required |
|---|---|---|---|
| title | string | Set a title for the column. | No |
| unit | string | A unit which should be displayed behind the column value. If this is time we automatically try to auto format the column to the users local time. |
No |
Chart
| Field | Type | Description | Required |
|---|---|---|---|
| type | string | The chart type. This could be pie, line or area. |
Yes |
| query | string | The query which which results should be used in the chart. | Yes |
| pieLabelColumn | string | The name of the column which should be used for the labels in the pie chart. This is required when the type is pie. |
No |
| pieValueColumn | string | The name of the column which should be used for the values in the pie chart. This is required when the type is pie. |
No |
| xAxisColumn | string | The column which should be used for the x axis. This is required when the type is line or area. |
No |
| xAxisType | string | The type for the x axis. This could be empty or time. |
No |
| xAxisUnit | string | The unit which should be used for the x axis. | No |
| yAxisColumns | []string | A list of columns which should be shown for the y axis. This is required when the type is line or area. |
No |
| yAxisUnit | string | The unit for the y axis. | No |
| yAxisStacked | boolean | When this is true the values of the y axis are stacked. |
No |
| legend | map |
A map of string pairs, to set the displayed title for a column in the legend. The key is the column name as returned by the query and the value is the shown title. | No |
Usage
Application
---
apiVersion: kobs.io/v1
kind: Application
metadata:
name: example-application
namespace: kobs
spec:
dashboards:
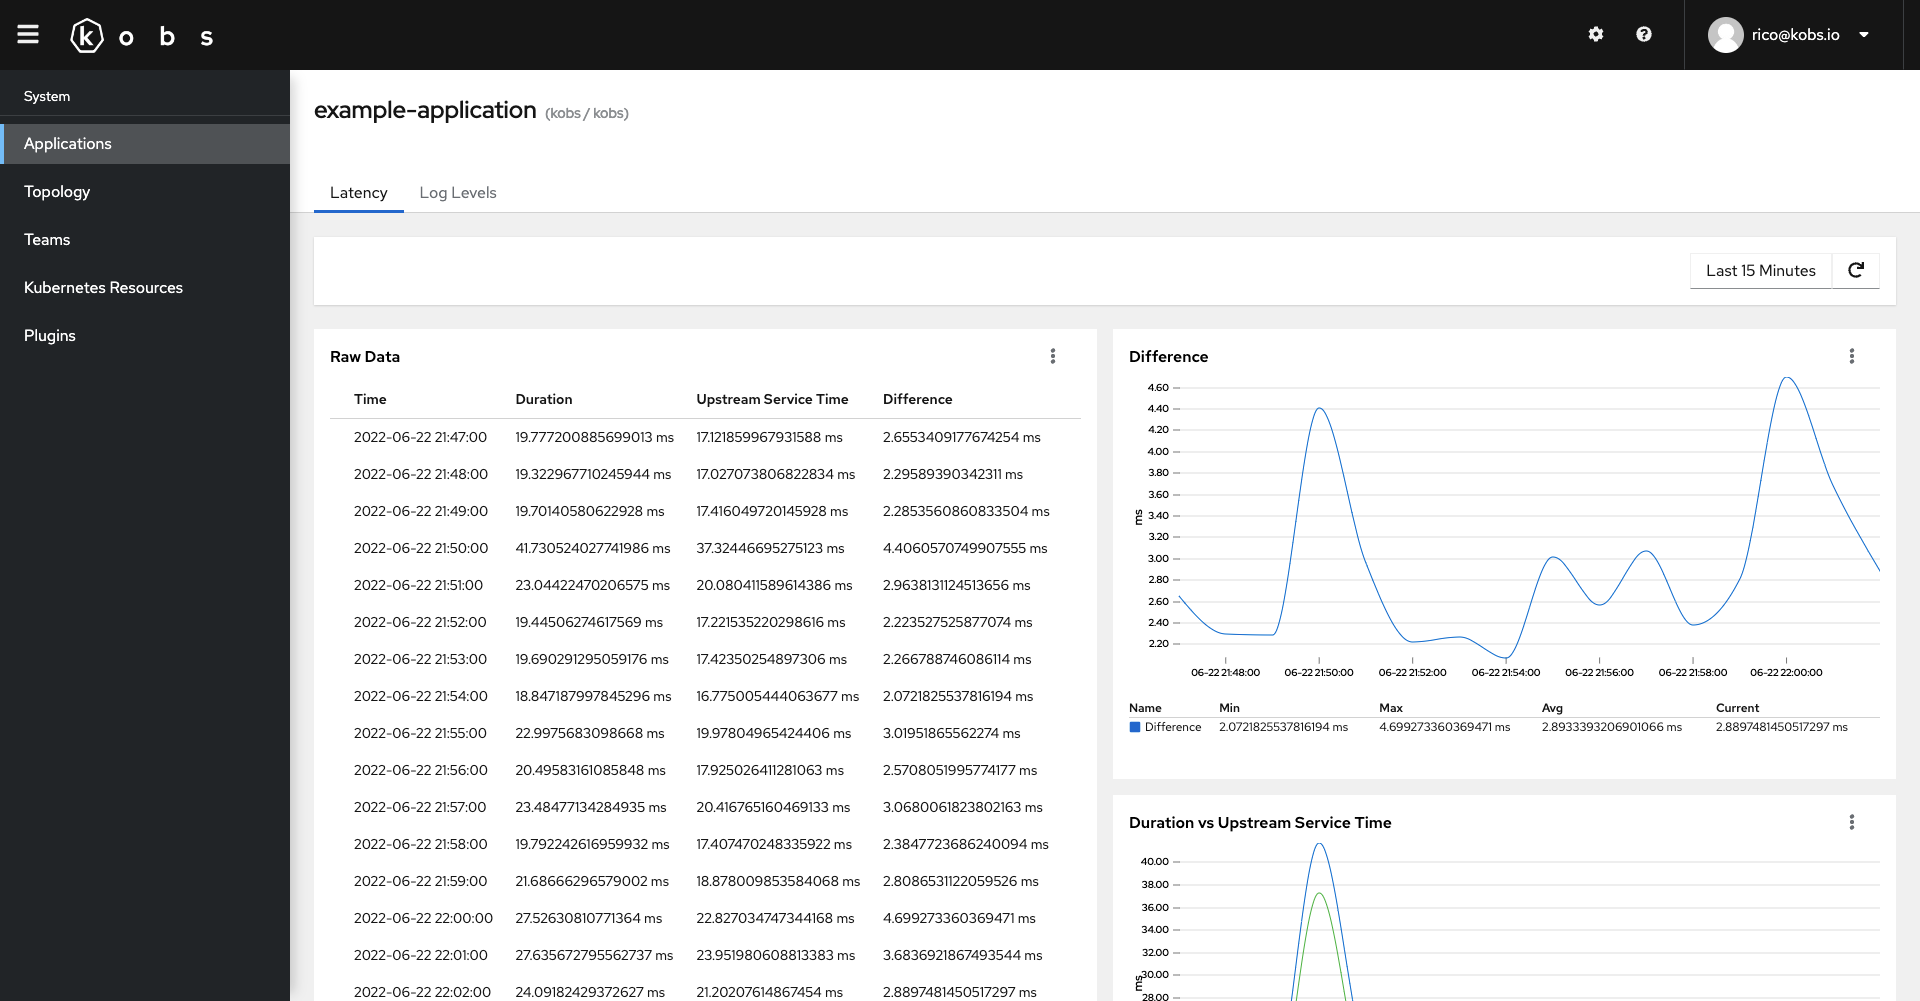
- title: Latency
inline:
rows:
- size: 3
panels:
- title: Raw Data
colSpan: 6
rowSpan: 2
plugin:
name: sql
type: sql
options:
type: table
queries:
- name: Duration and Upstream Service Time
query: |
SELECT
toStartOfInterval(timestamp, INTERVAL 60 second) AS time,
avg(fields_number.value[indexOf(fields_number.key, 'content.duration')]) as avg_duration,
avg(fields_number.value[indexOf(fields_number.key, 'content.upstream_service_time')]) as avg_ust,
avg_duration - avg_ust as avg_diff
FROM
logs.logs
WHERE
timestamp >= FROM_UNIXTIME({% .__timeStart %})
AND timestamp <= FROM_UNIXTIME({% .__timeEnd %})
AND namespace='myservice'
AND app='myservice'
AND container_name='istio-proxy'
AND match(fields_string.value[indexOf(fields_string.key, 'content.upstream_cluster')], '^inbound.*')
GROUP BY
time
ORDER BY
time
columns:
time:
title: Time
unit: time
avg_duration:
title: Duration
unit: ms
avg_ust:
title: Upstream Service Time
unit: ms
avg_diff:
title: Difference
unit: ms
- title: Difference
colSpan: 6
plugin:
name: sql
type: sql
options:
type: chart
chart:
type: line
query: |
SELECT
toStartOfInterval(timestamp, INTERVAL 60 second) AS time,
avg(fields_number.value[indexOf(fields_number.key, 'content.duration')]) - avg(fields_number.value[indexOf(fields_number.key, 'content.upstream_service_time')]) as avg_diff
FROM
logs.logs
WHERE
timestamp >= FROM_UNIXTIME({% .__timeStart %})
AND timestamp <= FROM_UNIXTIME({% .__timeEnd %})
AND namespace='myservice'
AND app='myservice'
AND container_name='istio-proxy'
AND match(fields_string.value[indexOf(fields_string.key, 'content.upstream_cluster')], '^inbound.*')
GROUP BY
time
ORDER BY
time
xAxisColumn: time
xAxisType: time
yAxisColumns:
- avg_diff
yAxisUnit: ms
yAxisStacked: false
legend:
avg_diff: Difference
- title: Duration vs Upstream Service Time
colSpan: 6
plugin:
name: sql
type: sql
options:
type: chart
chart:
type: line
query: |
SELECT
toStartOfInterval(timestamp, INTERVAL 60 second) AS time,
avg(fields_number.value[indexOf(fields_number.key, 'content.duration')]) as avg_duration,
avg(fields_number.value[indexOf(fields_number.key, 'content.upstream_service_time')]) as avg_ust
FROM
logs.logs
WHERE
timestamp >= FROM_UNIXTIME({% .__timeStart %})
AND timestamp <= FROM_UNIXTIME({% .__timeEnd %})
AND namespace='myservice'
AND app='myservice'
AND container_name='istio-proxy'
AND match(fields_string.value[indexOf(fields_string.key, 'content.upstream_cluster')], '^inbound.*')
GROUP BY
time
ORDER BY
time
xAxisColumn: time
xAxisType: time
yAxisColumns:
- avg_duration
- avg_ust
yAxisUnit: ms
yAxisStacked: false
legend:
avg_duration: Duration
avg_ust: Upstream Service Time
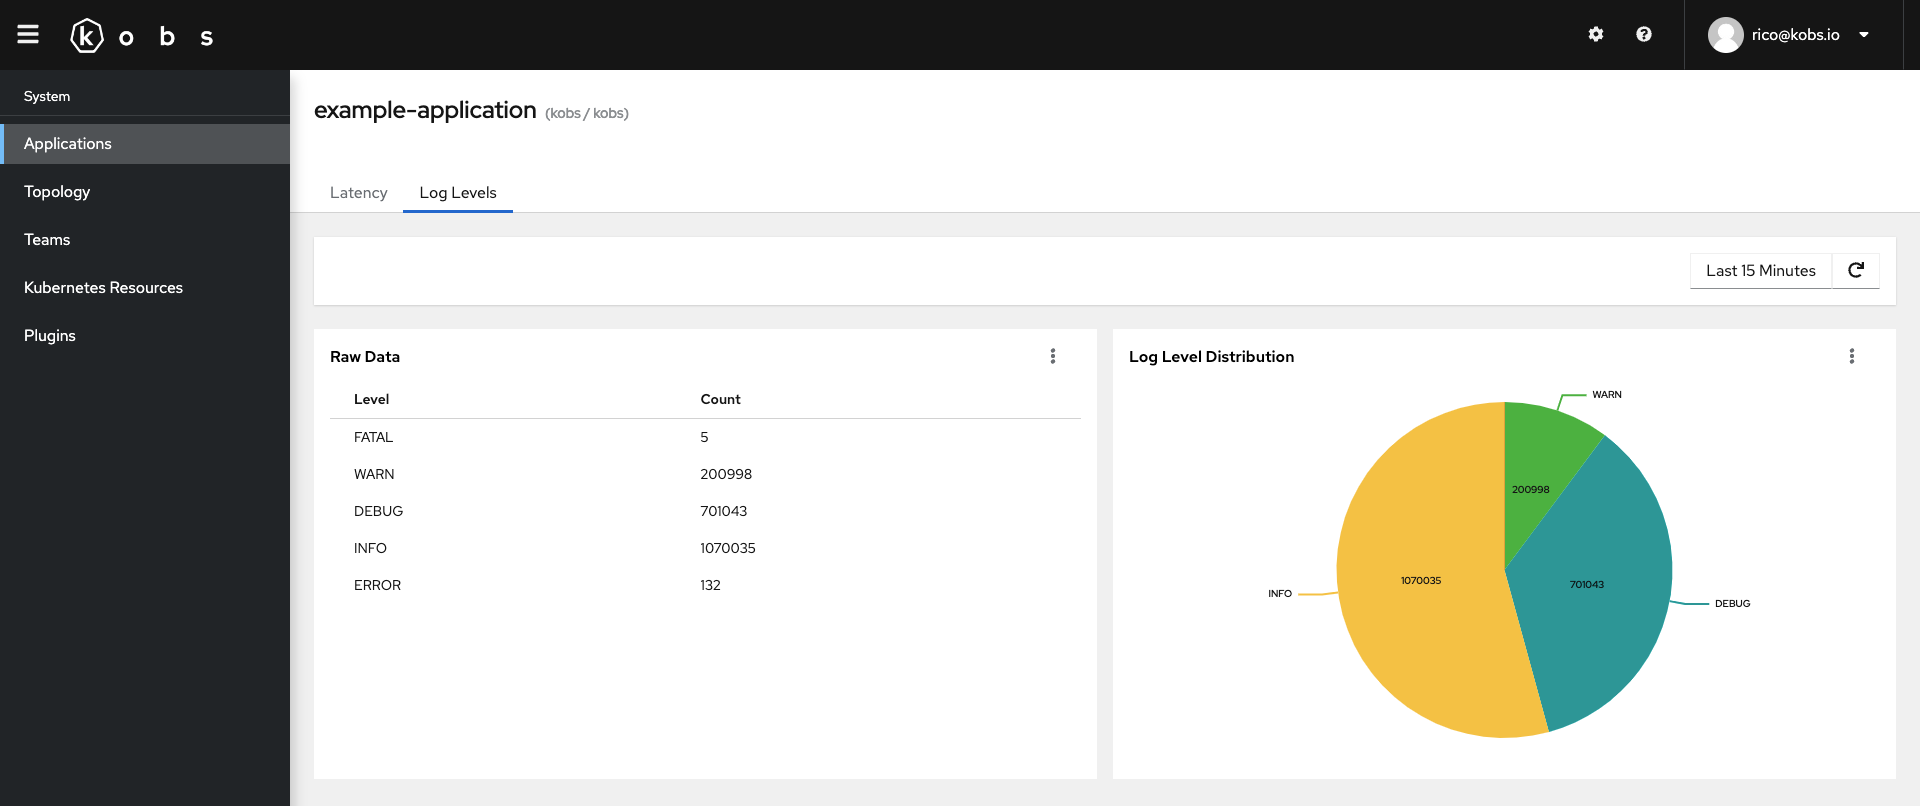
- title: Log Levels
inline:
rows:
- size: 3
panels:
- title: Raw Data
colSpan: 6
plugin:
name: sql
type: sql
options:
type: table
queries:
- name: Log Levels
query: |
SELECT
content.level,
count(content.level) as count_data
FROM
logs.logs
WHERE
timestamp >= FROM_UNIXTIME({% .__timeStart %})
AND timestamp <= FROM_UNIXTIME({% .__timeEnd %})
AND namespace='myservice'
AND app='myservice'
AND container_name='myservice'
GROUP BY
content.level
columns:
content.level:
title: Level
count_data:
title: Count
- title: Log Level Distribution
colSpan: 6
plugin:
name: sql
type: sql
options:
type: chart
chart:
type: pie
query: |
SELECT
content.level,
count(content.level) as count_data
FROM
logs.logs
WHERE
timestamp >= FROM_UNIXTIME({% .__timeStart %})
AND timestamp <= FROM_UNIXTIME({% .__timeEnd %})
AND namespace='myservice'
AND app='myservice'
AND container_name='myservice'
GROUP BY
content.level
pieLabelColumn: content.level
pieValueColumn: count_data