Grafana
The Grafana plugin can be used to search through all your Grafana dashboards and to show a list of dashboards or embed a Grafana panel within a kobs dashboard.
Configuration
The Grafana plugin can be used within the hub or cluster. To use the Grafana plugin the following configuration is needed:
| Field | Type | Description | Required |
|---|---|---|---|
| name | string | The name of the Grafana plugin instance. | Yes |
| type | grafana |
The type for the Grafana plugin. | Yes |
| options.address | string | Address of the Grafana instance. | Yes |
| options.username | string | Username to access an Grafana instance via basic authentication. | No |
| options.password | string | Password to access an Grafana instance via basic authentication. | No |
| options.token | string | Token to access an Grafana instance via token based authentication. | No |
| frontendOptions.address | string | The address of the Grafana instance, which can be accessed by the user. | No |
plugins:
  - name: grafana
    type: grafana
    options:
      address:
      username:
      password:
      token:
    frontendOptions:
      address:
Insight Options
Note
The Grafana plugin can not be used within the insights section of an application.
Variable Options
Note
The Grafana plugin can not be used to get a list of variable values.
Panel Options
The following options can be used for a panel with the Grafana plugin:
| Field | Type | Description | Required |
|---|---|---|---|
| type | string | The panel type. This could be dashboards or panel. |
No |
| dashboards | []string | A list of dashboard ids to show, when the type is dashboards. To pass variables to a dashboard the following can be used: <dashboard-id>?myvar=myvarvalue |
Yes |
| panel | Panel | The panel which should be displayed, when the type is panel. |
Yes |
Panel
| Field | Type | Description | Required |
|---|---|---|---|
| dashboardID | string | The id of the dashboard. | Yes |
| panelID | string | The id of the panel. | Yes |
| variables | map |
A map of variables, with the name of the variable as key and the value of the variable as value. | No |
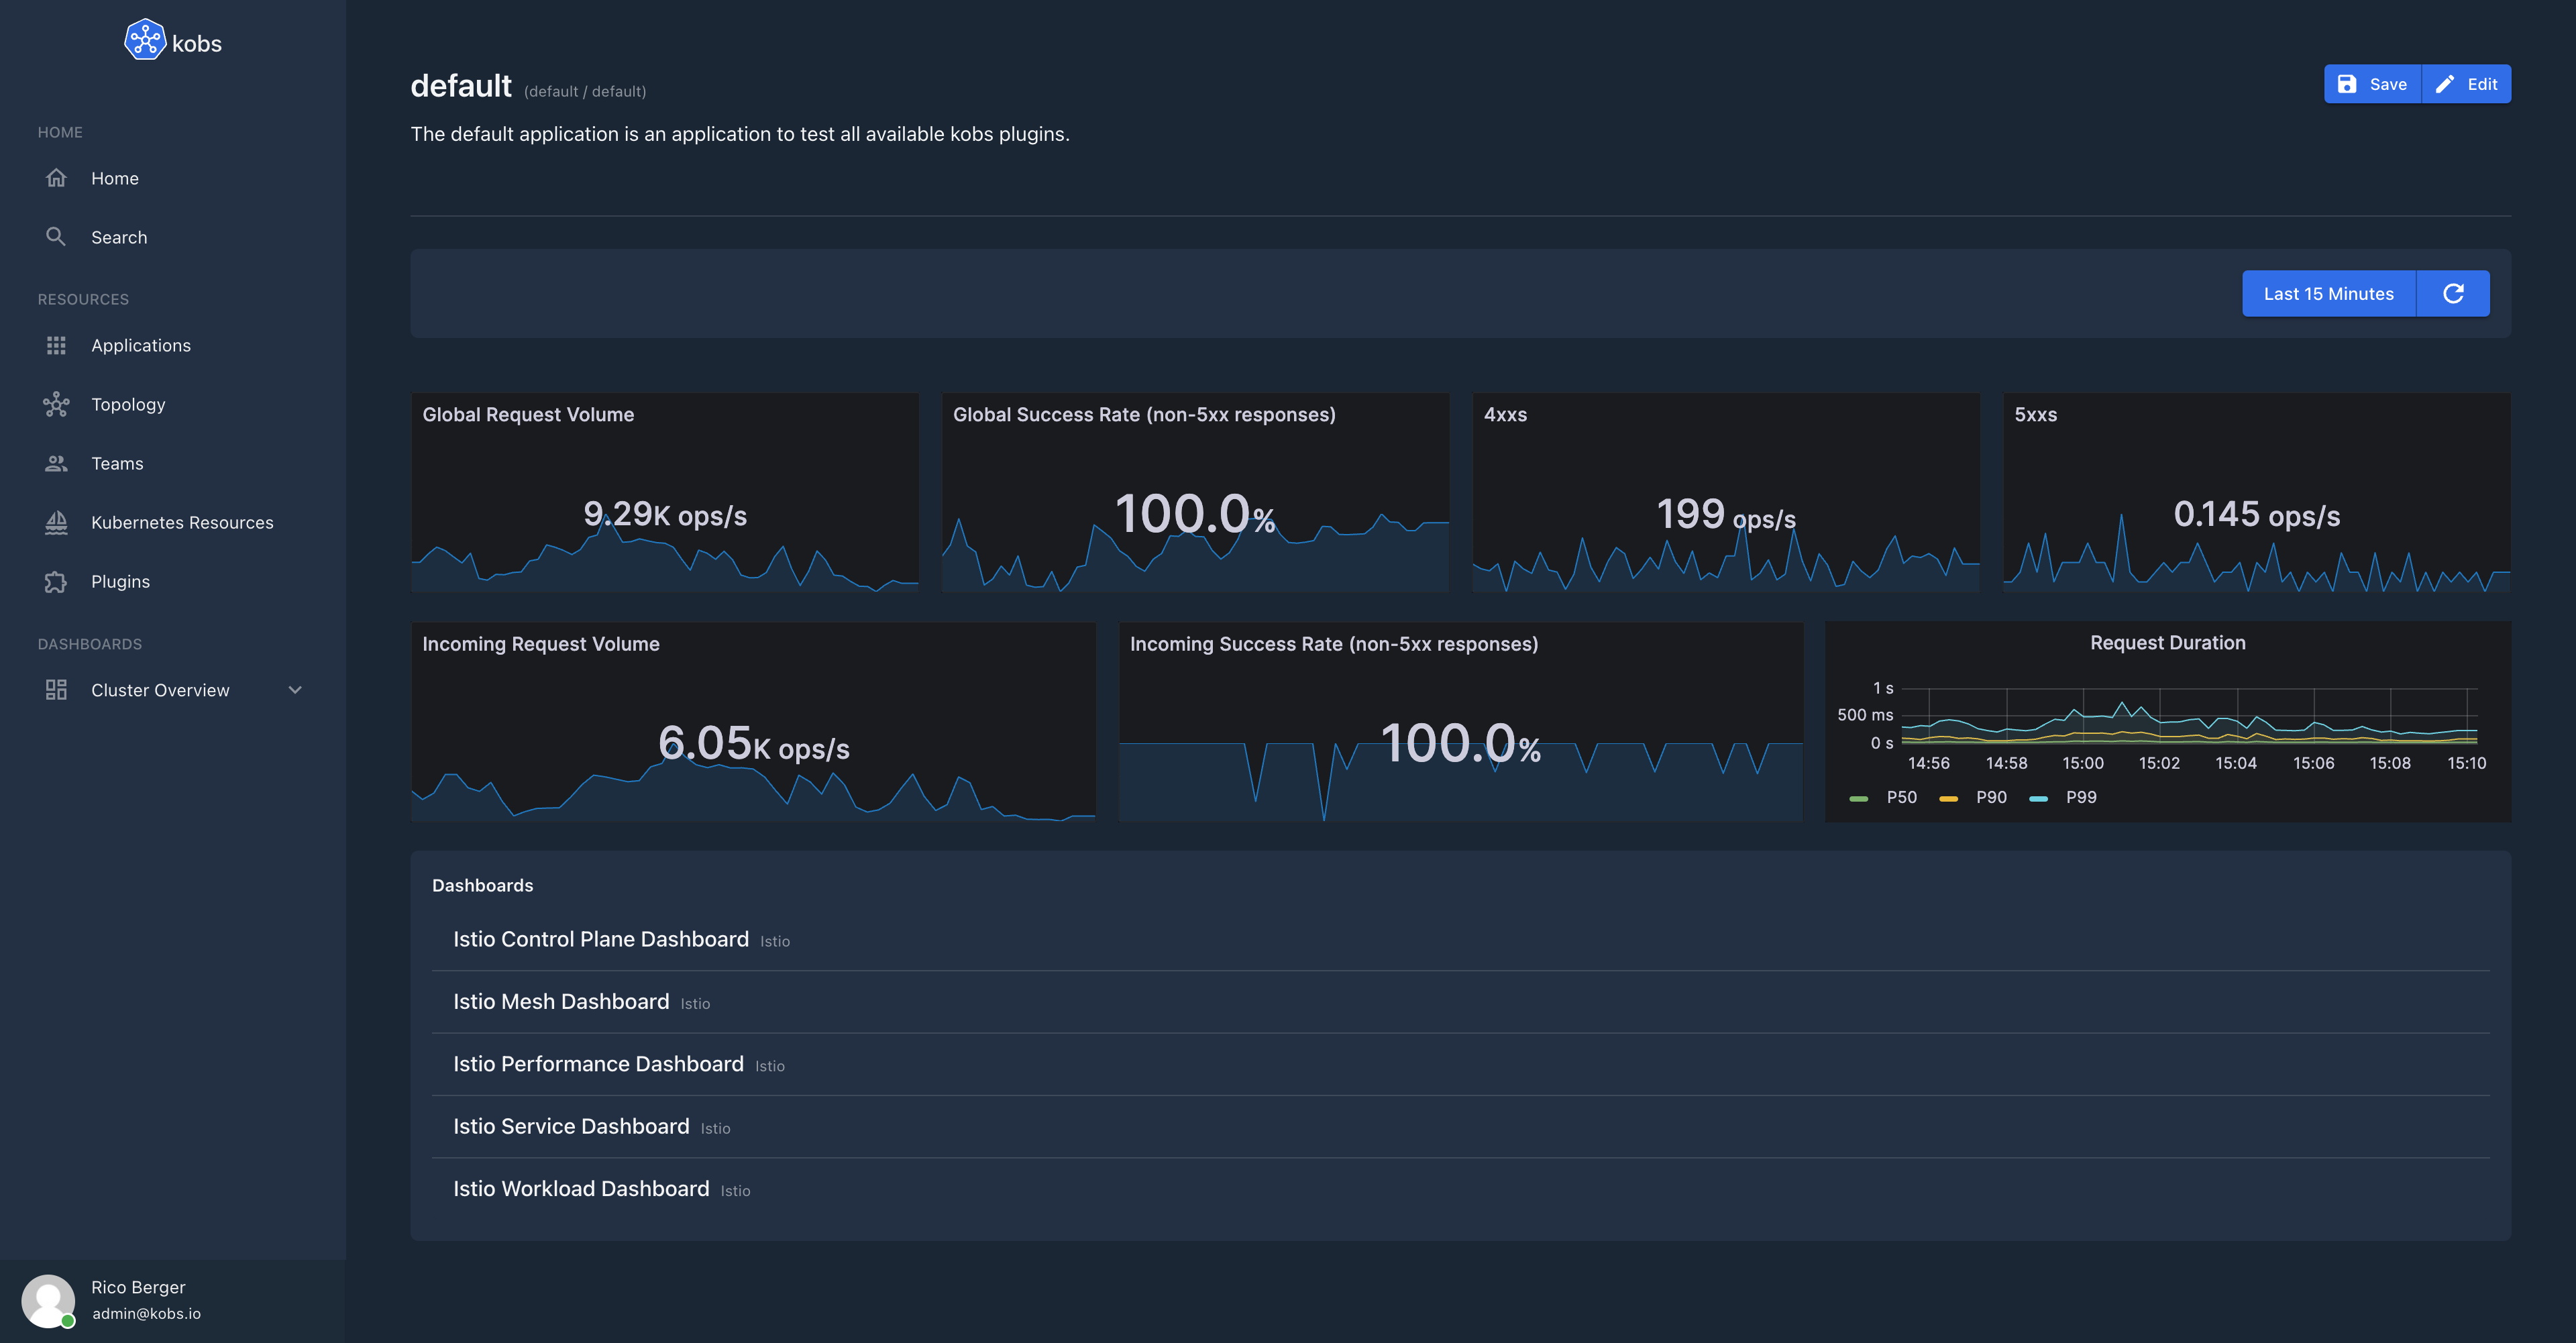
Usage
The following dashboards shows some panels from a Grafana plugin and a list of dashboards from this instance. The dashboard also uses some variables, which are then passed to the panels from Grafana.
---
apiVersion: kobs.io/v1
kind: Application
metadata:
  name: default
  namespace: default
spec:
  description: The default application is an application to test all available kobs plugins.
  dashboards:
    - title: Grafana
      inline:
        rows:
          - autoHeight: true
            panels:
              - title: Global Request Volume
                plugin:
                  name: grafana
                  type: grafana
                  options:
                    type: panel
                    panel:
                      dashboardID: G8wLrJIZk
                      panelID: '20'
                h: 4
                w: 3
                x: 0
                'y': 0
              - title: Global Success Rate
                plugin:
                  name: grafana
                  type: grafana
                  options:
                    type: panel
                    panel:
                      dashboardID: G8wLrJIZk
                      panelID: '21'
                h: 4
                w: 3
                x: 3
                'y': 0
              - title: 4xx
                plugin:
                  name: grafana
                  type: grafana
                  options:
                    type: panel
                    panel:
                      dashboardID: G8wLrJIZk
                      panelID: '22'
                h: 4
                w: 3
                x: 6
                'y': 0
              - title: 5xx
                plugin:
                  name: grafana
                  type: grafana
                  options:
                    type: panel
                    panel:
                      dashboardID: G8wLrJIZk
                      panelID: '23'
                h: 4
                w: 3
                x: 9
                'y': 0

          - autoHeight: true
            panels:
              - title: Incoming Request Volume
                plugin:
                  name: grafana
                  type: grafana
                  options:
                    type: panel
                    panel:
                      dashboardID: UbsSZTDik
                      panelID: '12'
                      variables:
                        var-datasource: default
                        var-namespace: backend
                        var-workload: backend
                        var-qrep: destination
                        var-srcns: All
                        var-srcwl: All
                        var-dstsvc: All
                h: 6
                w: 4
                x: 0
                'y': 0
              - title: Incoming Success Rate
                plugin:
                  name: grafana
                  type: grafana
                  options:
                    type: panel
                    panel:
                      dashboardID: UbsSZTDik
                      panelID: '14'
                      variables:
                        var-datasource: default
                        var-namespace: backend
                        var-workload: backend
                        var-qrep: destination
                        var-srcns: All
                        var-srcwl: All
                        var-dstsvc: All
                h: 6
                w: 4
                x: 4
                'y': 0
              - title: Request Duration
                plugin:
                  name: grafana
                  type: grafana
                  options:
                    type: panel
                    panel:
                      dashboardID: UbsSZTDik
                      panelID: '87'
                      variables:
                        var-datasource: default
                        var-namespace: backend
                        var-workload: backend
                        var-qrep: destination
                        var-srcns: All
                        var-srcwl: All
                        var-dstsvc: All
                h: 6
                w: 4
                x: 8
                'y': 0

          - autoHeight: true
            panels:
              - title: Dashboards
                plugin:
                  name: grafana
                  type: grafana
                  options:
                    type: dashboards
                    dashboards:
                      - 3--MLVZZk
                      - G8wLrJIZk
                      - vu8e0VWZk
                      - LJ_uJAvmk
                      - UbsSZTDik
                h: 6
                w: 12
                x: 0
                'y': 0