Runbooks
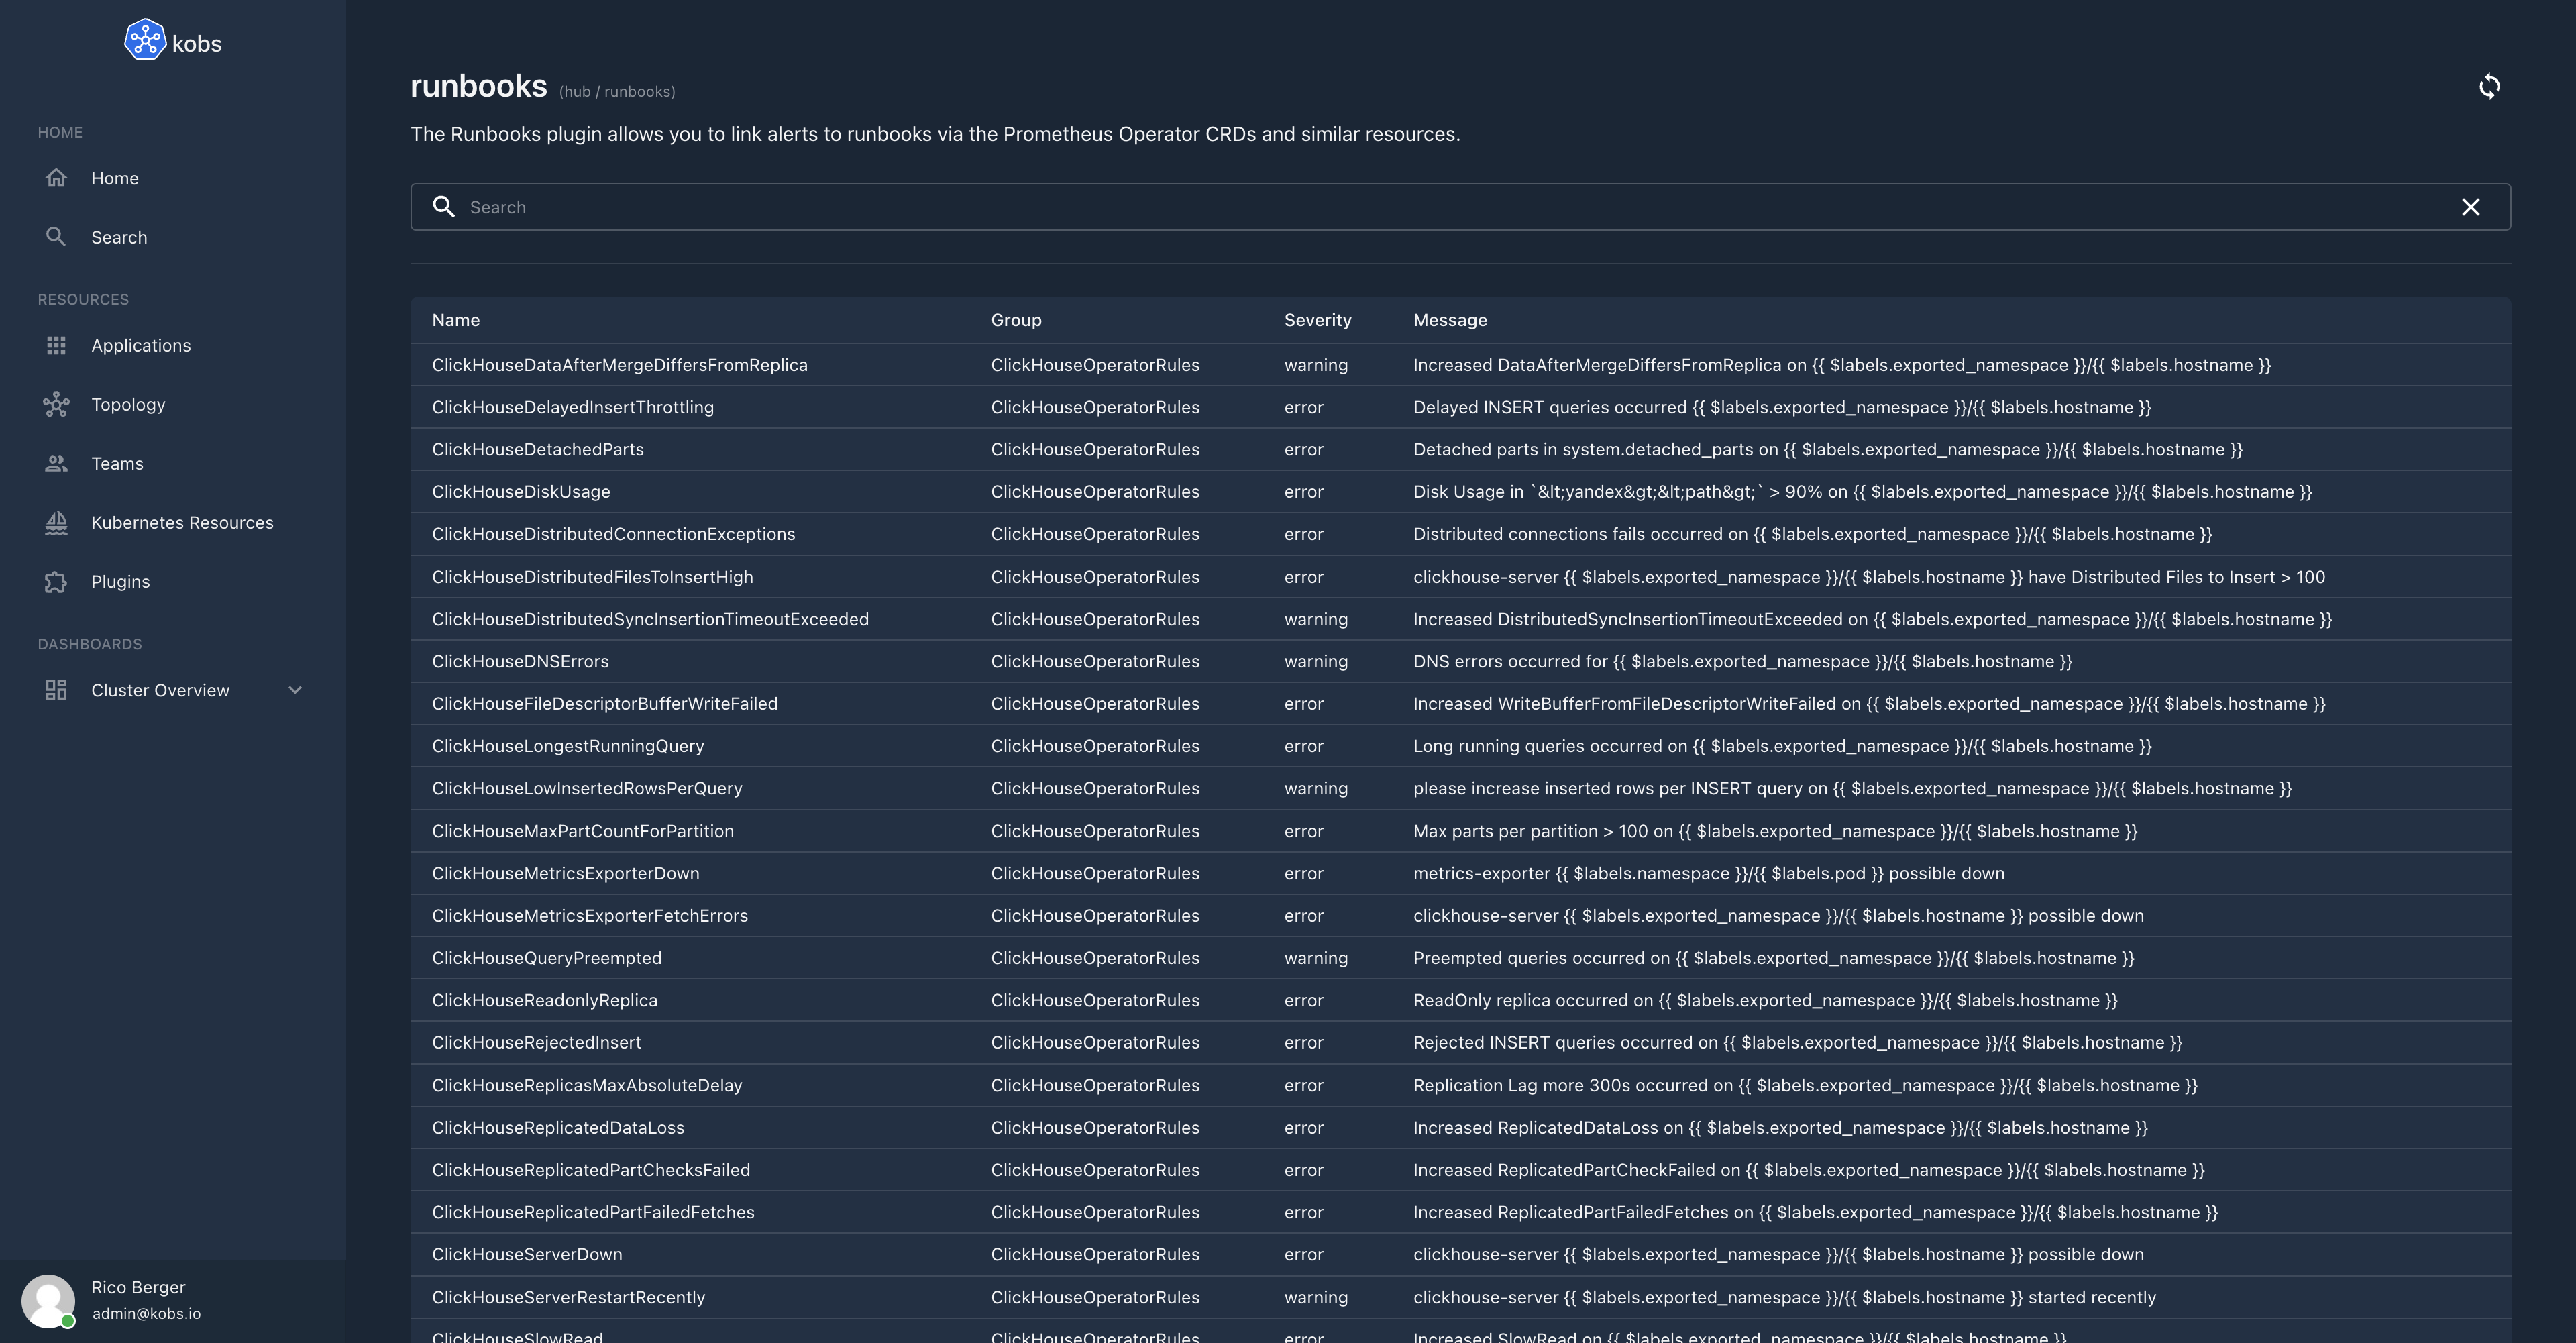
The Runbooks plugin can be used to manage runbooks within the Prometheus Operator CRDs or similar CRDs. To add a runbook to an PrometheusRule an runbook annotation must be added. The runbooks are markdown formatted and can use the same features as the TechDocs plugin.
Configuration
The Runbooks plugin can only be used within the hub. To use the Runbooks plugin the following configuration is needed:
| Field | Type | Description | Required |
|---|---|---|---|
| name | string | The name of the Runbooks plugin instance. | Yes |
| type | runbooks |
The type for the Runbooks plugin. | Yes |
| options.path | string | The Kubernetes API path for the resource, which should be used for the runbooks. | Yes |
| options.resource | string | The Kubernetes API resource, which should be used for the runbooks. | Yes |
plugins:
  - name: runbooks
    type: runbooks
    options:
      ## The path and resource fields could also point to another PrometheusRule compatible resource, e.g. the VictoriaMetrics rules:
      #   path: /apis/operator.victoriametrics.com/v1beta1
      #   resource: vmrules
      path: /apis/monitoring.coreos.com/v1
      resource: prometheusrule
Insight Options
Note
The Runbooks plugin can not be used within the insights section of an application.
Variable Options
Note
The Runbooks plugin can not be used to get a list of variable values.
Panel Options
The following options can be used for a panel with the Runbooks plugin:
| Field | Type | Description | Required |
|---|---|---|---|
| type | string | The type for the Runbooks panel. This must be list to render a list of runbooks or details to render a single runbook. |
No |
| query | string | A search query to render the list of runbooks. | No |
| alert | string | The name of the alert. | No |
| group | string | The groups of the alert. | No |
Usage
The following example shows a VMRule with a runbook:
---
apiVersion: operator.victoriametrics.com/v1beta1
kind: VMRule
metadata:
name: clickhouse-alert-rules
namespace: monitoring
spec:
groups:
- name: ClickHouseOperatorRules
rules:
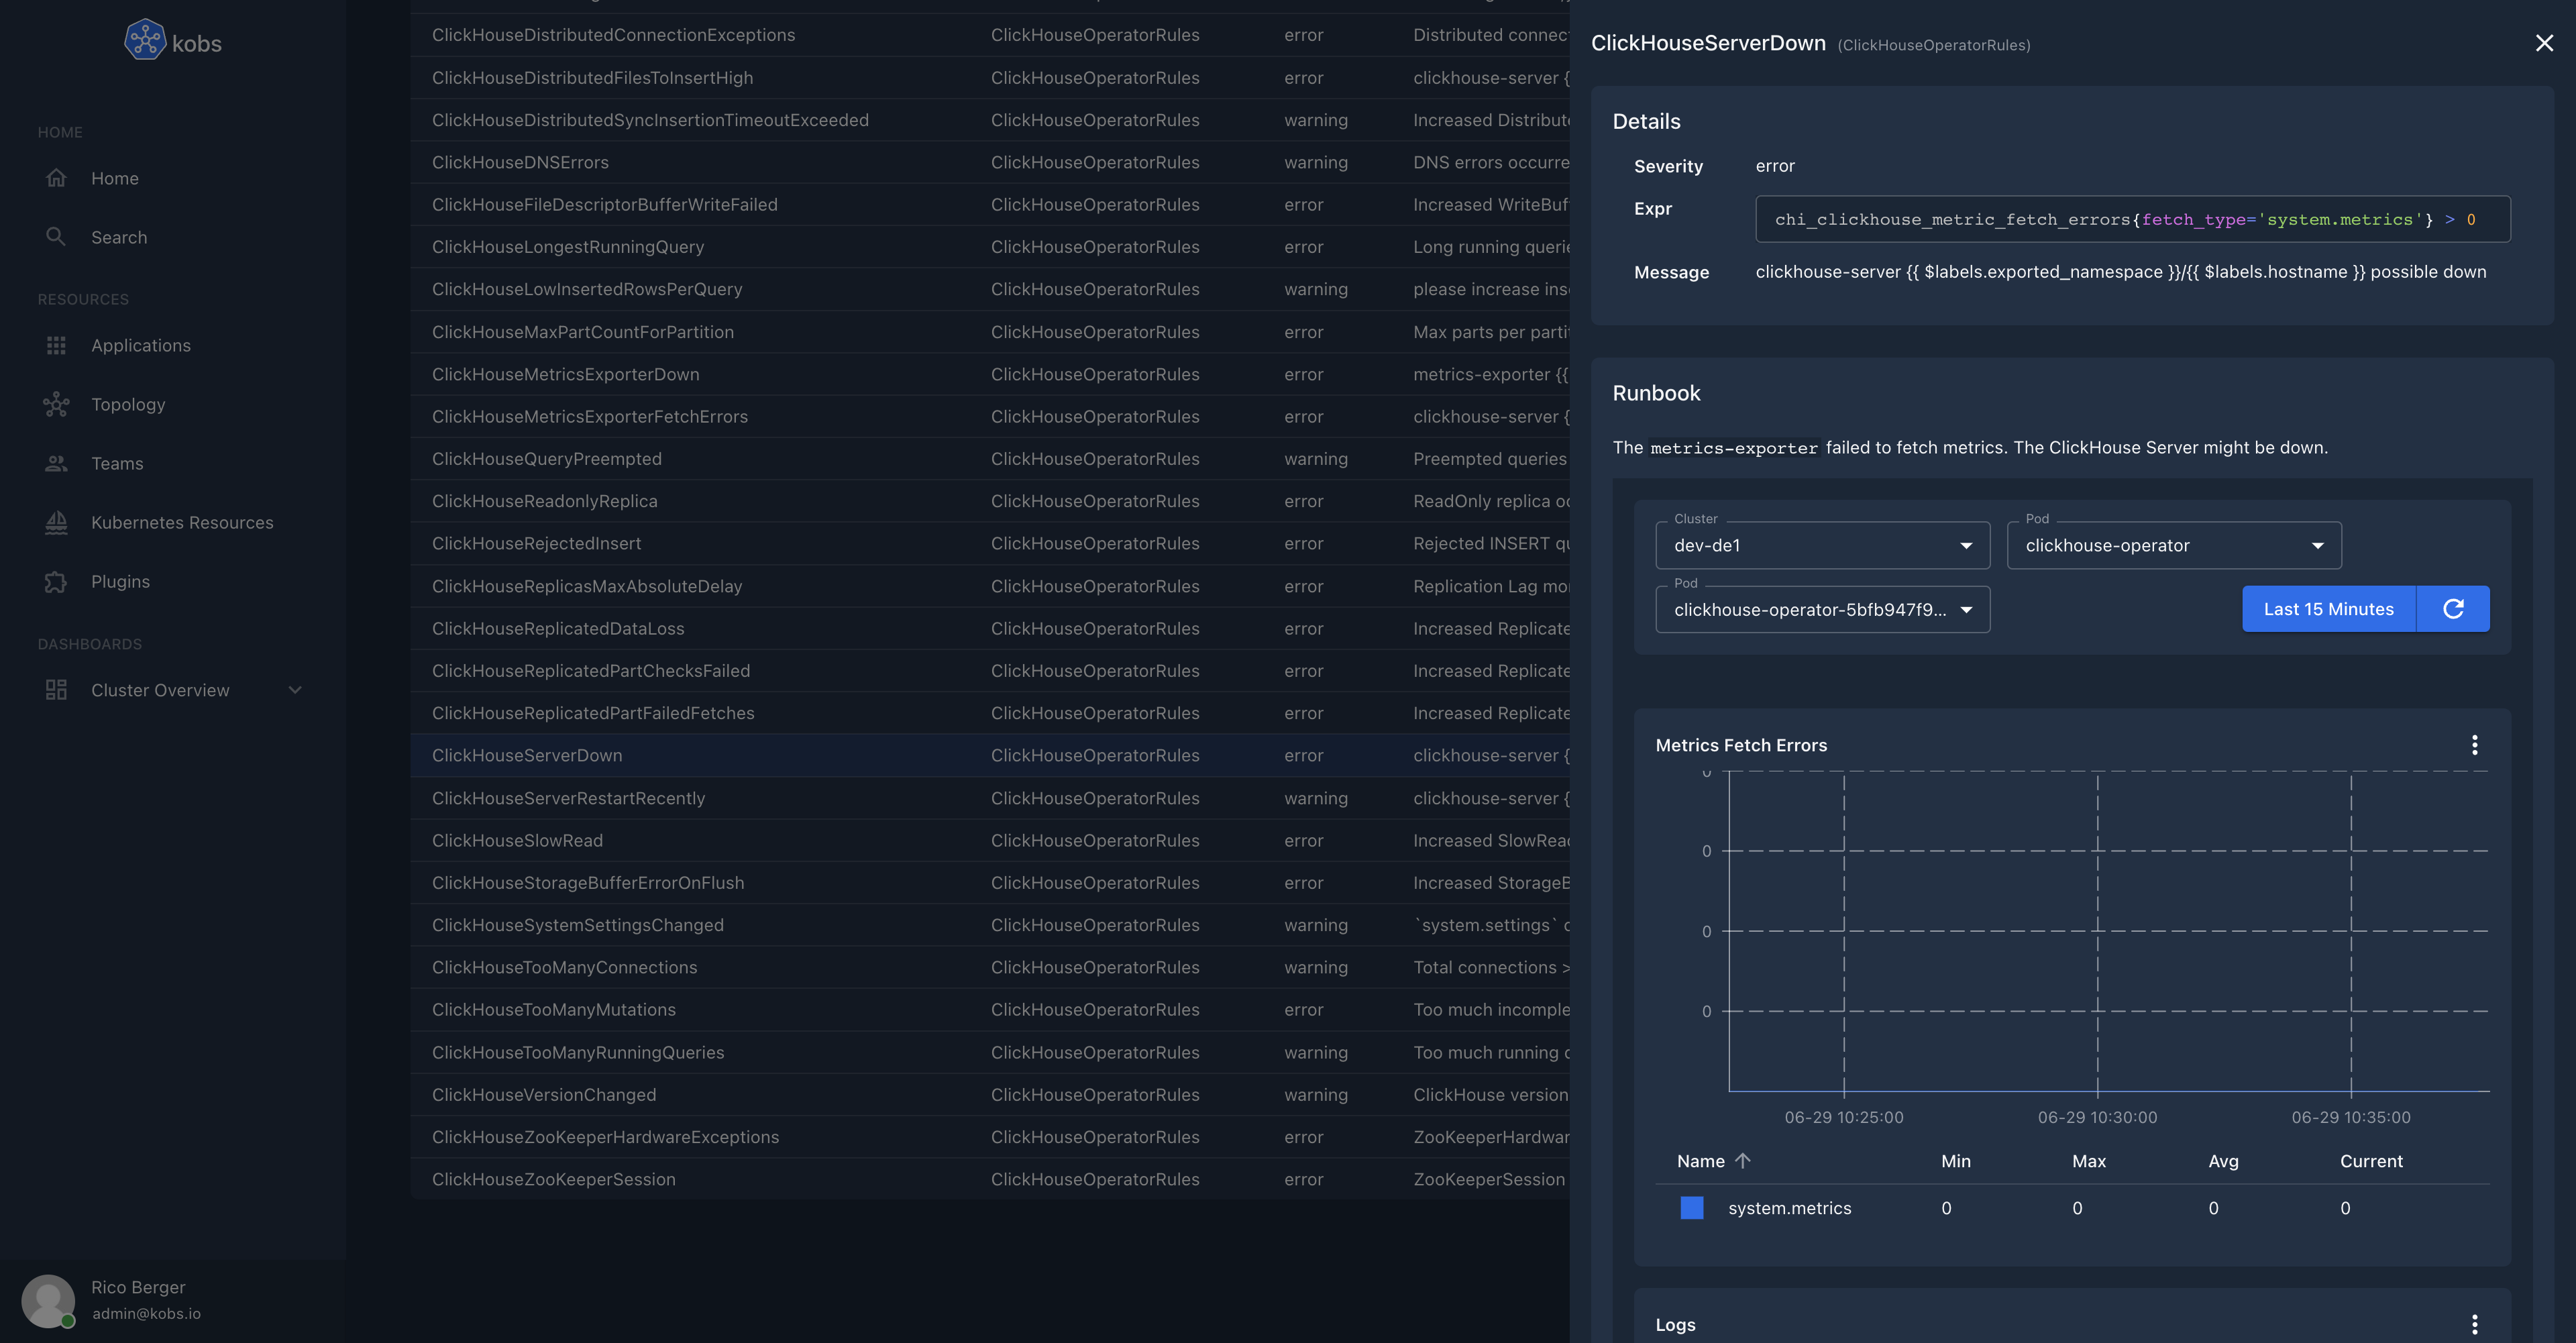
- alert: ClickHouseServerDown
expr: chi_clickhouse_metric_fetch_errors{fetch_type='system.metrics'} > 0
for: 5m
labels:
namespace: "{{ $labels.exported_namespace }}"
severity: error
annotations:
message: "clickhouse-server {{ $labels.exported_namespace }}/{{ $labels.hostname }} possible down"
runbook: |
The `metrics-exporter` failed to fetch metrics. The ClickHouse Server might be down.
```kobs:dashboard
- title: 'ClickHouseServerDown'
inline:
variables:
- name: var_cluster
label: Cluster
includeAllOption: false
plugin:
name: static
type: core
options:
- dev-de1
- stage-de1
- prod-de1
- prod-us1
- name: var_namespace
label: Pod
includeAllOption: false
plugin:
type: prometheus
name: prometheus
cluster: "{% .var_cluster %}"
options:
type: labelValues
label: namespace
query: chi_clickhouse_metric_fetch_errors
- name: var_pod
label: Pod
includeAllOption: false
plugin:
type: prometheus
name: prometheus
cluster: "{% .var_cluster %}"
options:
type: labelValues
label: pod
query: chi_clickhouse_metric_fetch_errors
rows:
- panels:
- title: Metrics Fetch Errors
plugin:
type: prometheus
name: prometheus
cluster: "{% .var_cluster %}"
options:
legend: table
queries:
- label: "system.metrics"
query: sum(chi_clickhouse_metric_fetch_errors{fetch_type="system.metrics", namespace="{% .var_namespace %}", pod="{% .var_pod %}"})
type: line
h: 9
w: 12
x: 0
'y': 0
- autoHeight: true
panels:
- title: Logs
plugin:
type: klogs
name: klogs
cluster: "{% .var_cluster %}"
options:
type: logs
queries:
- name: Instance Logs
query: "namespace='{% .var_namespace %}' _and_ pod_name='{% .var_pod %}' _and_ container_name='clickhouse'"
h: 9
w: 12
x: 0
'y': 0
```
To add some common instructions to all alerts in an alert group you can add a kobs.io/<ALERTGROUP> annotation, e.g.:
---
apiVersion: operator.victoriametrics.com/v1beta1
kind: VMRule
metadata:
  name: clickhouse-alert-rules
  namespace: monitoring
  aanotation:
    kobs.io/ClickHouseOperatorRules: |
      Here you can add some common actions which are visible within all alerts in the ClickHouseOperatorRules alert group.
spec:
  groups:
    - name: ClickHouseOperatorRules
      rules:
        - alert: ClickHouseServerDown