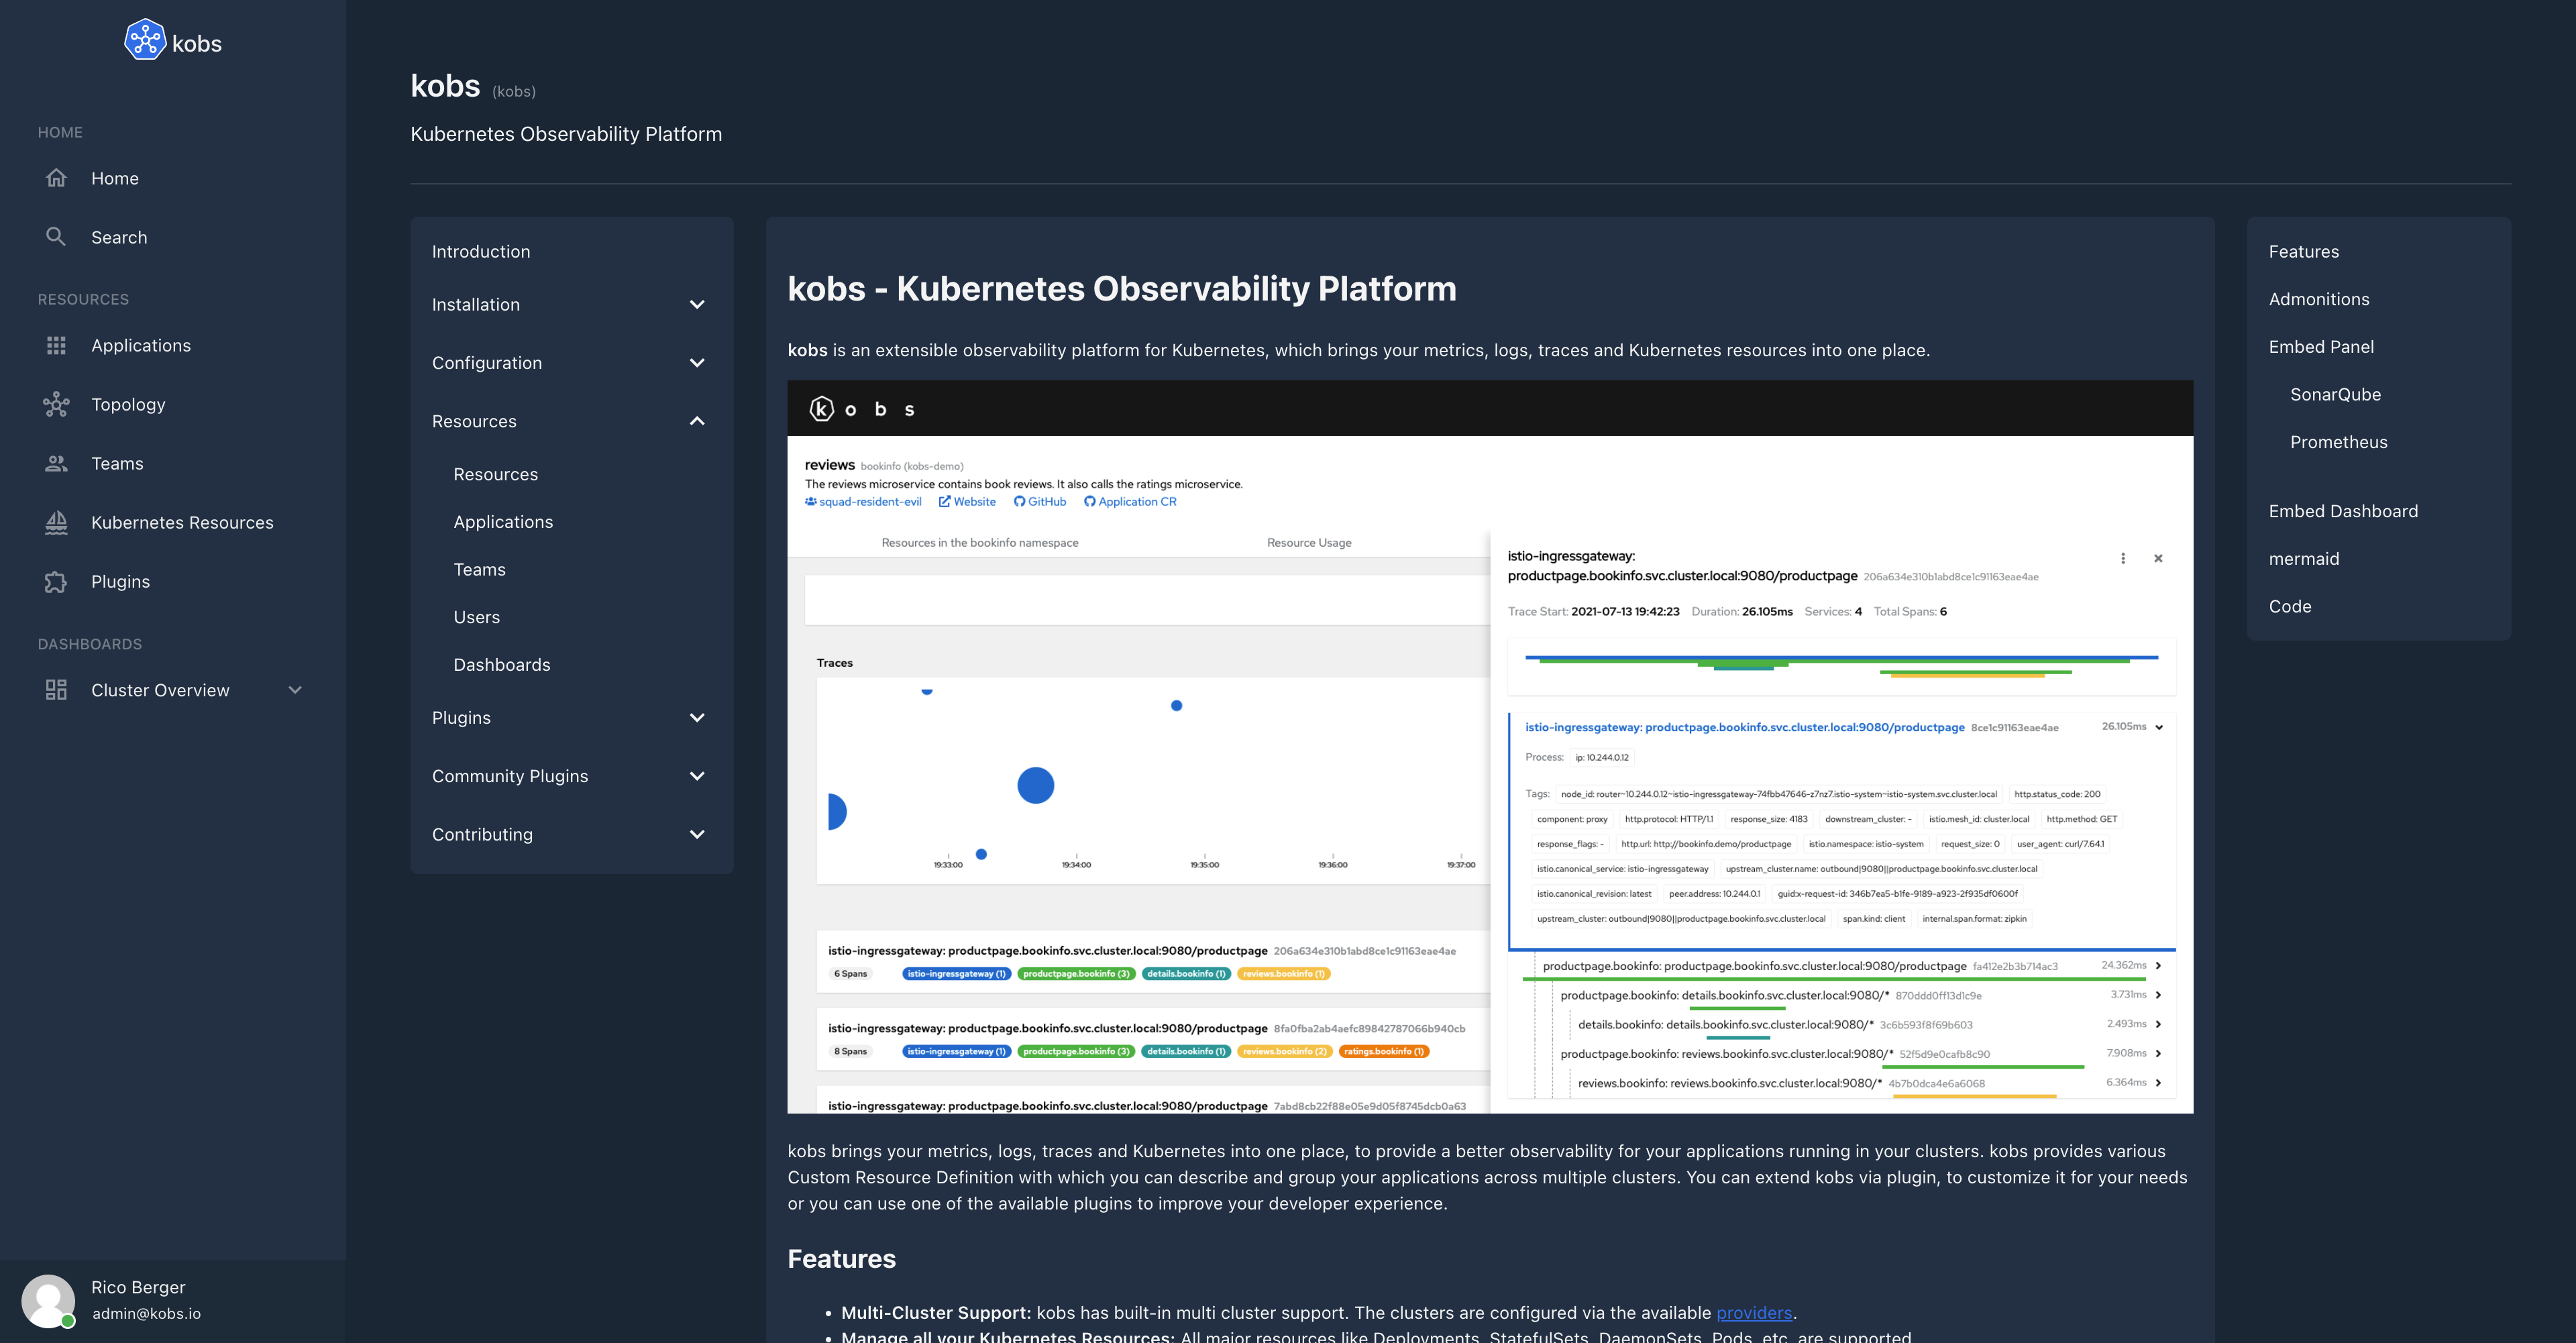
TechDocs
The TechDocs plugin allows your engineers to write their documentation in markdown files which live together with their code and display them in kobs.
Configuration
The TechDocs plugin can only be used within the hub. To use the TechDocs plugin the following configuration is needed:
| Field | Type | Description | Required |
|---|---|---|---|
| name | string | The name of the TechDocs plugin instance. | Yes |
| type | techdocs |
The type for the TechDocs plugin. | Yes |
| options.provider.type | string | The provider type. Must be local, s3 or azure |
Yes |
| options.provider.local.rootDirectory | string | The path to the directory, which contains all the folders with your TechDocs for your services. | Yes |
| options.provider.s3.endpoint | string | The endpoint for your S3 bucket. | Yes |
| options.provider.s3.accessKeyID | string | The access key id for your S3 bucket. | Yes |
| options.provider.s3.secretAccessKey | string | The secret access key for your S3 bucket. | Yes |
| options.provider.s3.bucket | string | The name of the S3 bucket with your TechDocs. | Yes |
| options.provider.s3.useSSL | boolean | Use SSL to access the S3 bucket. | No |
| options.provider.azure.accountName | boolean | The name of the Azure storage account. | Yes |
| options.provider.azure.accountKey | boolean | The key for the Azure storage account. | Yes |
plugins:
  - name: techdocs
    type: techdocs
    options:
      provider:
        type: local
        local:
          rootDirectory:
        # type: s3
        # s3:
        #   endpoint:
        #   accessKeyID:
        #   secretAccessKey:
        #   bucket:
        #   useSSL
        # type: azure
        # azure:
        #   accountName:
        #   accountKey:
Insight Options
Note
The TechDocs plugin can not be used within the insights section of an application.
Variable Options
Note
The TechDocs plugin can not be used to get a list of variable values.
Panel Options
The following options can be used for a panel with the TechDocs plugin:
| Field | Type | Description | Required |
|---|---|---|---|
| type | string | The type which should be used for the TechDocs panel. Must be services to render the list of all available services, service-toc to render the table of contents for a service, service-markdown to render the TechDocs for a service or markdown to render a markdown text. |
Yes |
| service | string | The name of the service. This value is required when the type is service-toc or service-markdown. |
No |
| service | string | The markdown text. This value is required when the type is markdown. |
No |
Usage
The TechDocs plugin renders the markdown files for your service. For that you have to provide the files for kobs via S3 or via a file system which kobs can access.
File Structure
The TechDocs for all of your service must live in their own folder. Lets say we have four services productpage, details, ratings and reviews. All of these services have their own documentation, so that the final structure for kobs should look as follows:
techdocs
├── details
│   └── index.yaml
├── productpage
│   ├── configuration
│   │   ├── addbooks.md
│   │   └── getting-started.md
│   ├── index.md
│   ├── index.yaml
│   └── installation
│       ├── helm.md
│       └── kustomize.md
├── ratings
│   └── index.yaml
└── reviews
    └── index.yaml
As you can see each folder must also contain a index.yaml file with the following content:
# The key should be a unique identifier for all of your TechDocs.
# It must have the same name as the folder, where the TechDocs for the service are stored for kobs.
key: productpage
# The name of your service and a short description of your service.
name: Productpage
description: The productpage for the bookinfo application.
# The first markdown file which should be shown, when a user opens the TechDocs for the service.
home: index.md
# The table of contents for your service, with links to all the markdown files should can be accessed by a user.
toc:
  - Home: index.md
  - Installation:
      - Helm: installation/helm.md
      - Kustomize: installation/kustomize.md
  - Configuration:
      - Getting Started: configuration/getting-started.md
      - Add Books: configuration/addbooks.md
Admonitions
The TechDocs plugin supports admonitions. The syntax to add admonitions to your markdown files is as follows:
:::info{title="My info title"}
My info text
:::
:::success{title="My success title"}
My success text
:::
:::warning{title="My warning title"}
My warning text
:::
:::error{title="My error title"}
My error text
:::
Admonitions can also be collapsed by adding the collapse="true" property:
:::info{title="My info title" collapse="true"}
My info text
:::
:::success{title="My success title" collapse="true"}
My success text
:::
:::warning{title="My warning title" collapse="true"}
My warning text
:::
:::error{title="My error title" collapse="true"}
My error text
:::
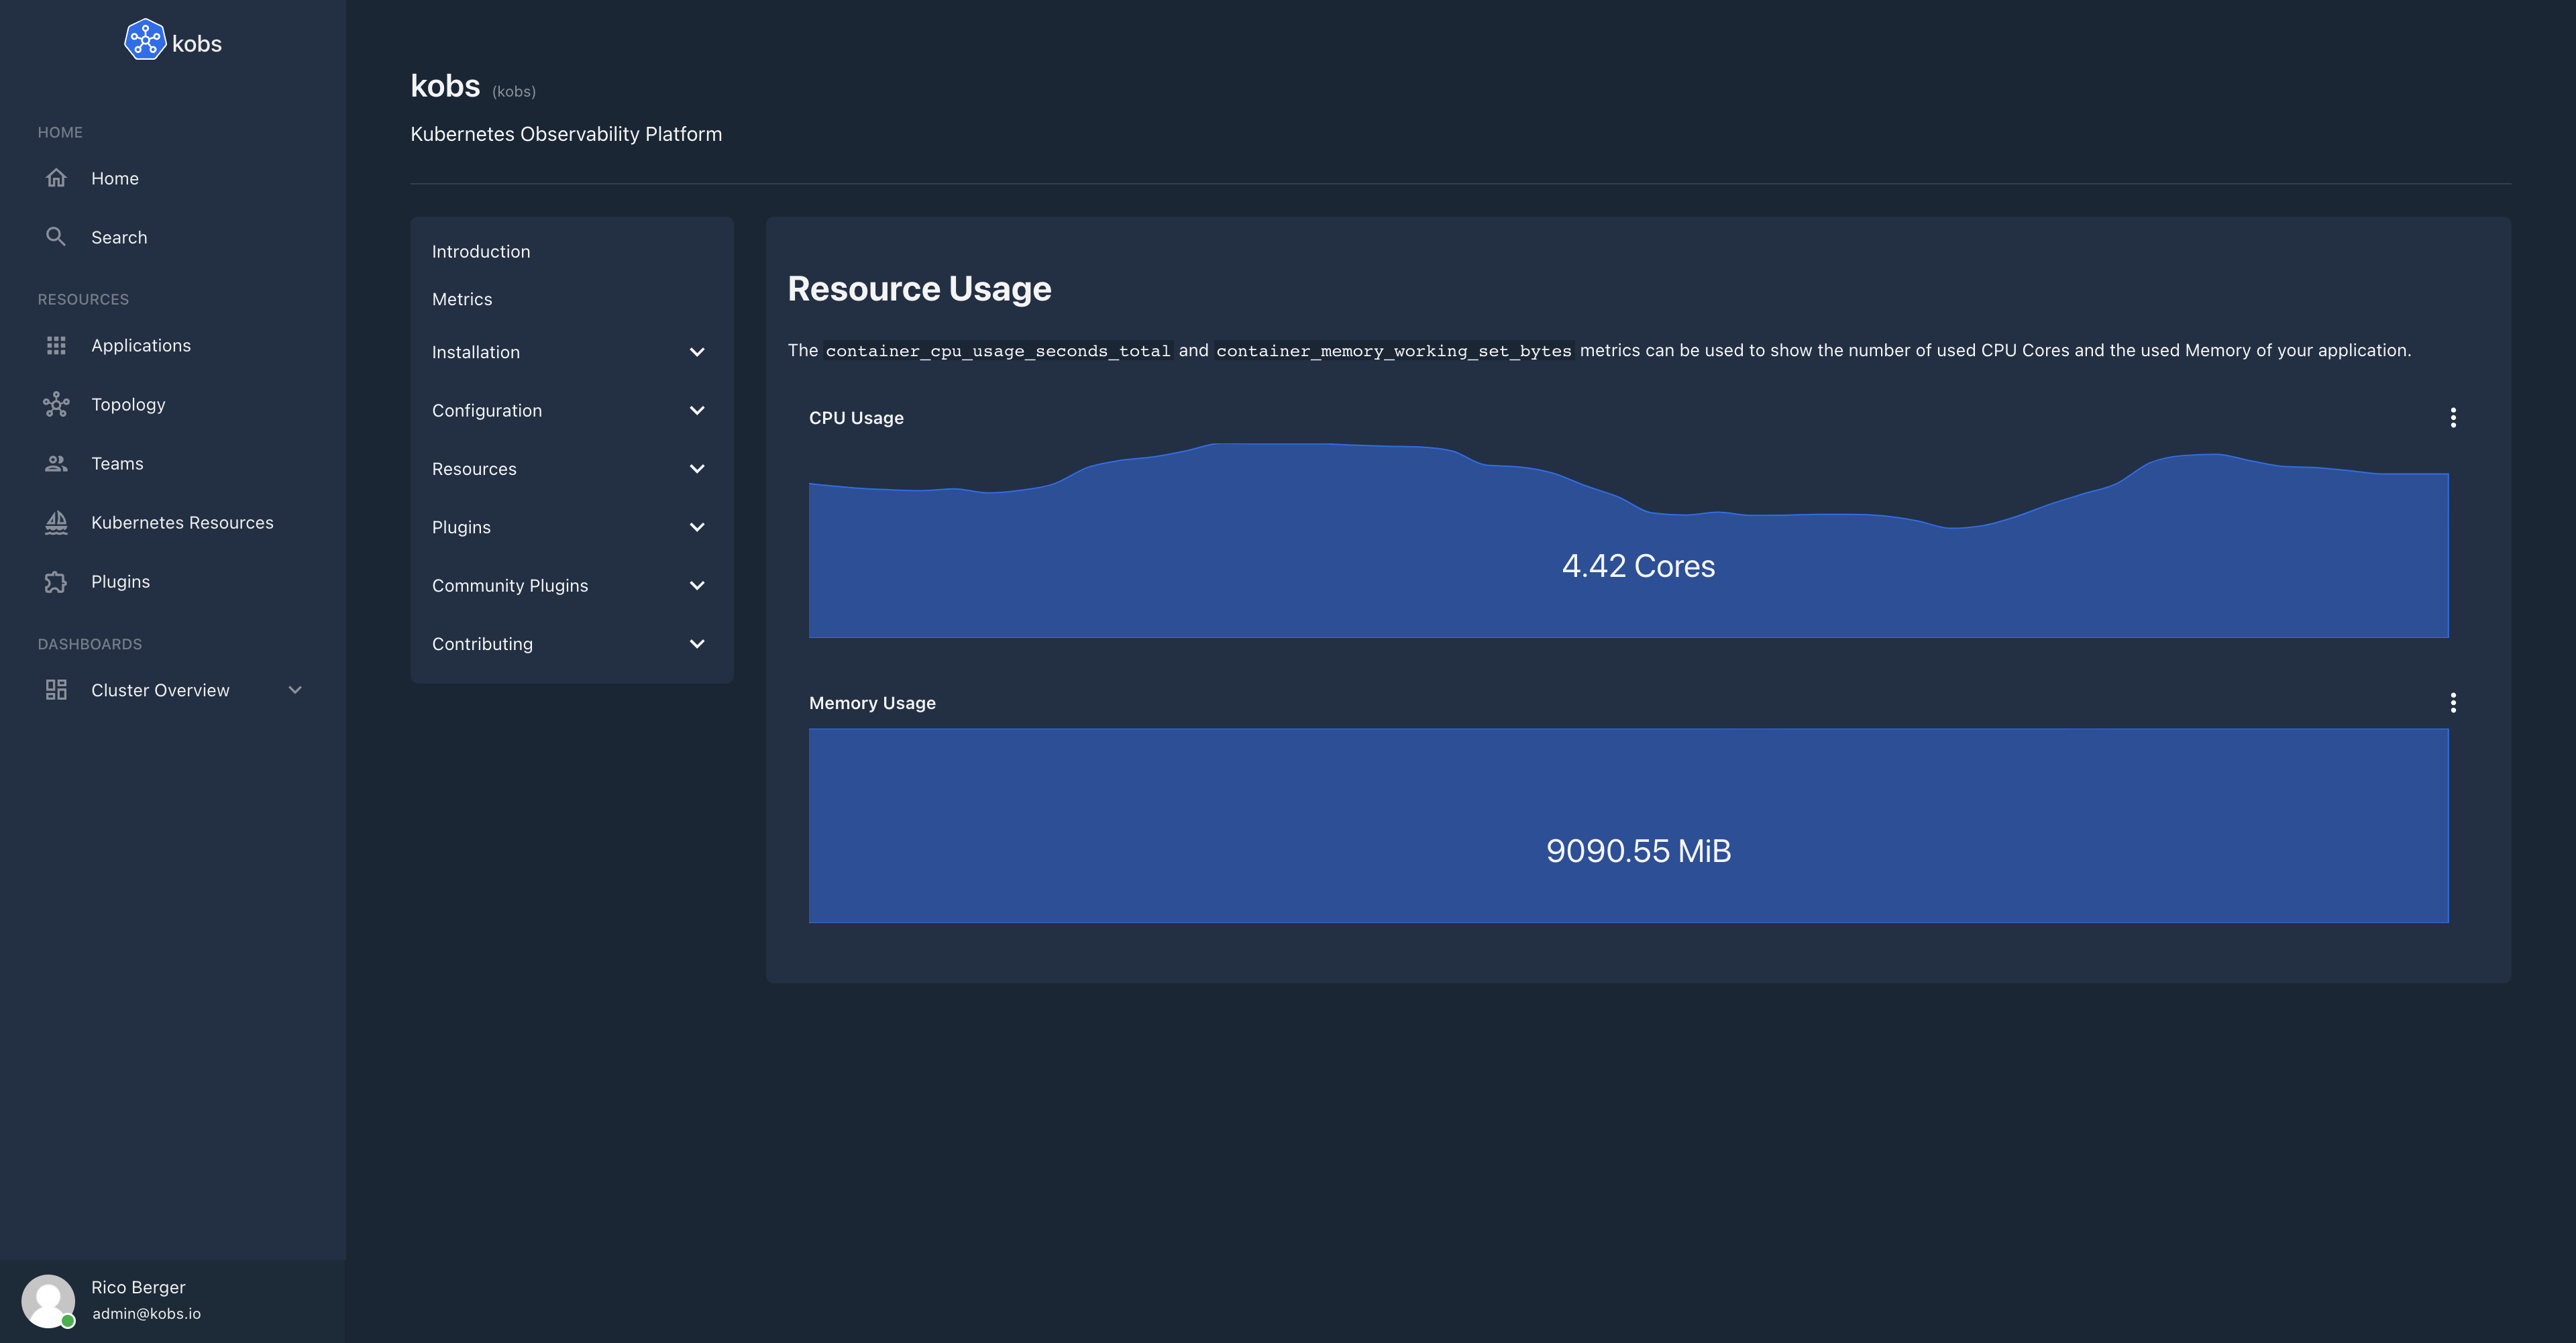
Embed kobs Panels
You can add kobs panels to your TechDocs in the same way how they are used within applications, dashboards, teams and users. To add a panel to your documentation you have to use a code block with the kobs:panel language.
# Resource Usage

The `container_cpu_usage_seconds_total` and `container_memory_working_set_bytes` metrics can be used to show the number of used CPU Cores and the used Memory of your application.

```kobs:panel
title: CPU Usage
plugin:
  type: prometheus
  name: prometheus
  cluster: prod-de1
  options:
    queries:
      - query: >-
          avg(rate(container_cpu_usage_seconds_total{namespace="backend", image!="", pod=~"backend-.*",
          container!="POD", container!="", container=~"backend"}[2m]))
    type: sparkline
    unit: Cores
```

```kobs:panel
title: Memory Usage
plugin:
  type: prometheus
  name: prometheus
  cluster: prod-de1
  options:
    queries:
      - query: >-
          avg(container_memory_working_set_bytes{namespace="backend", pod=~"backend-.*", container!="POD",
          container!="", container=~"backend"}) /
          1024 / 1024
    type: sparkline
    unit: MiB
```
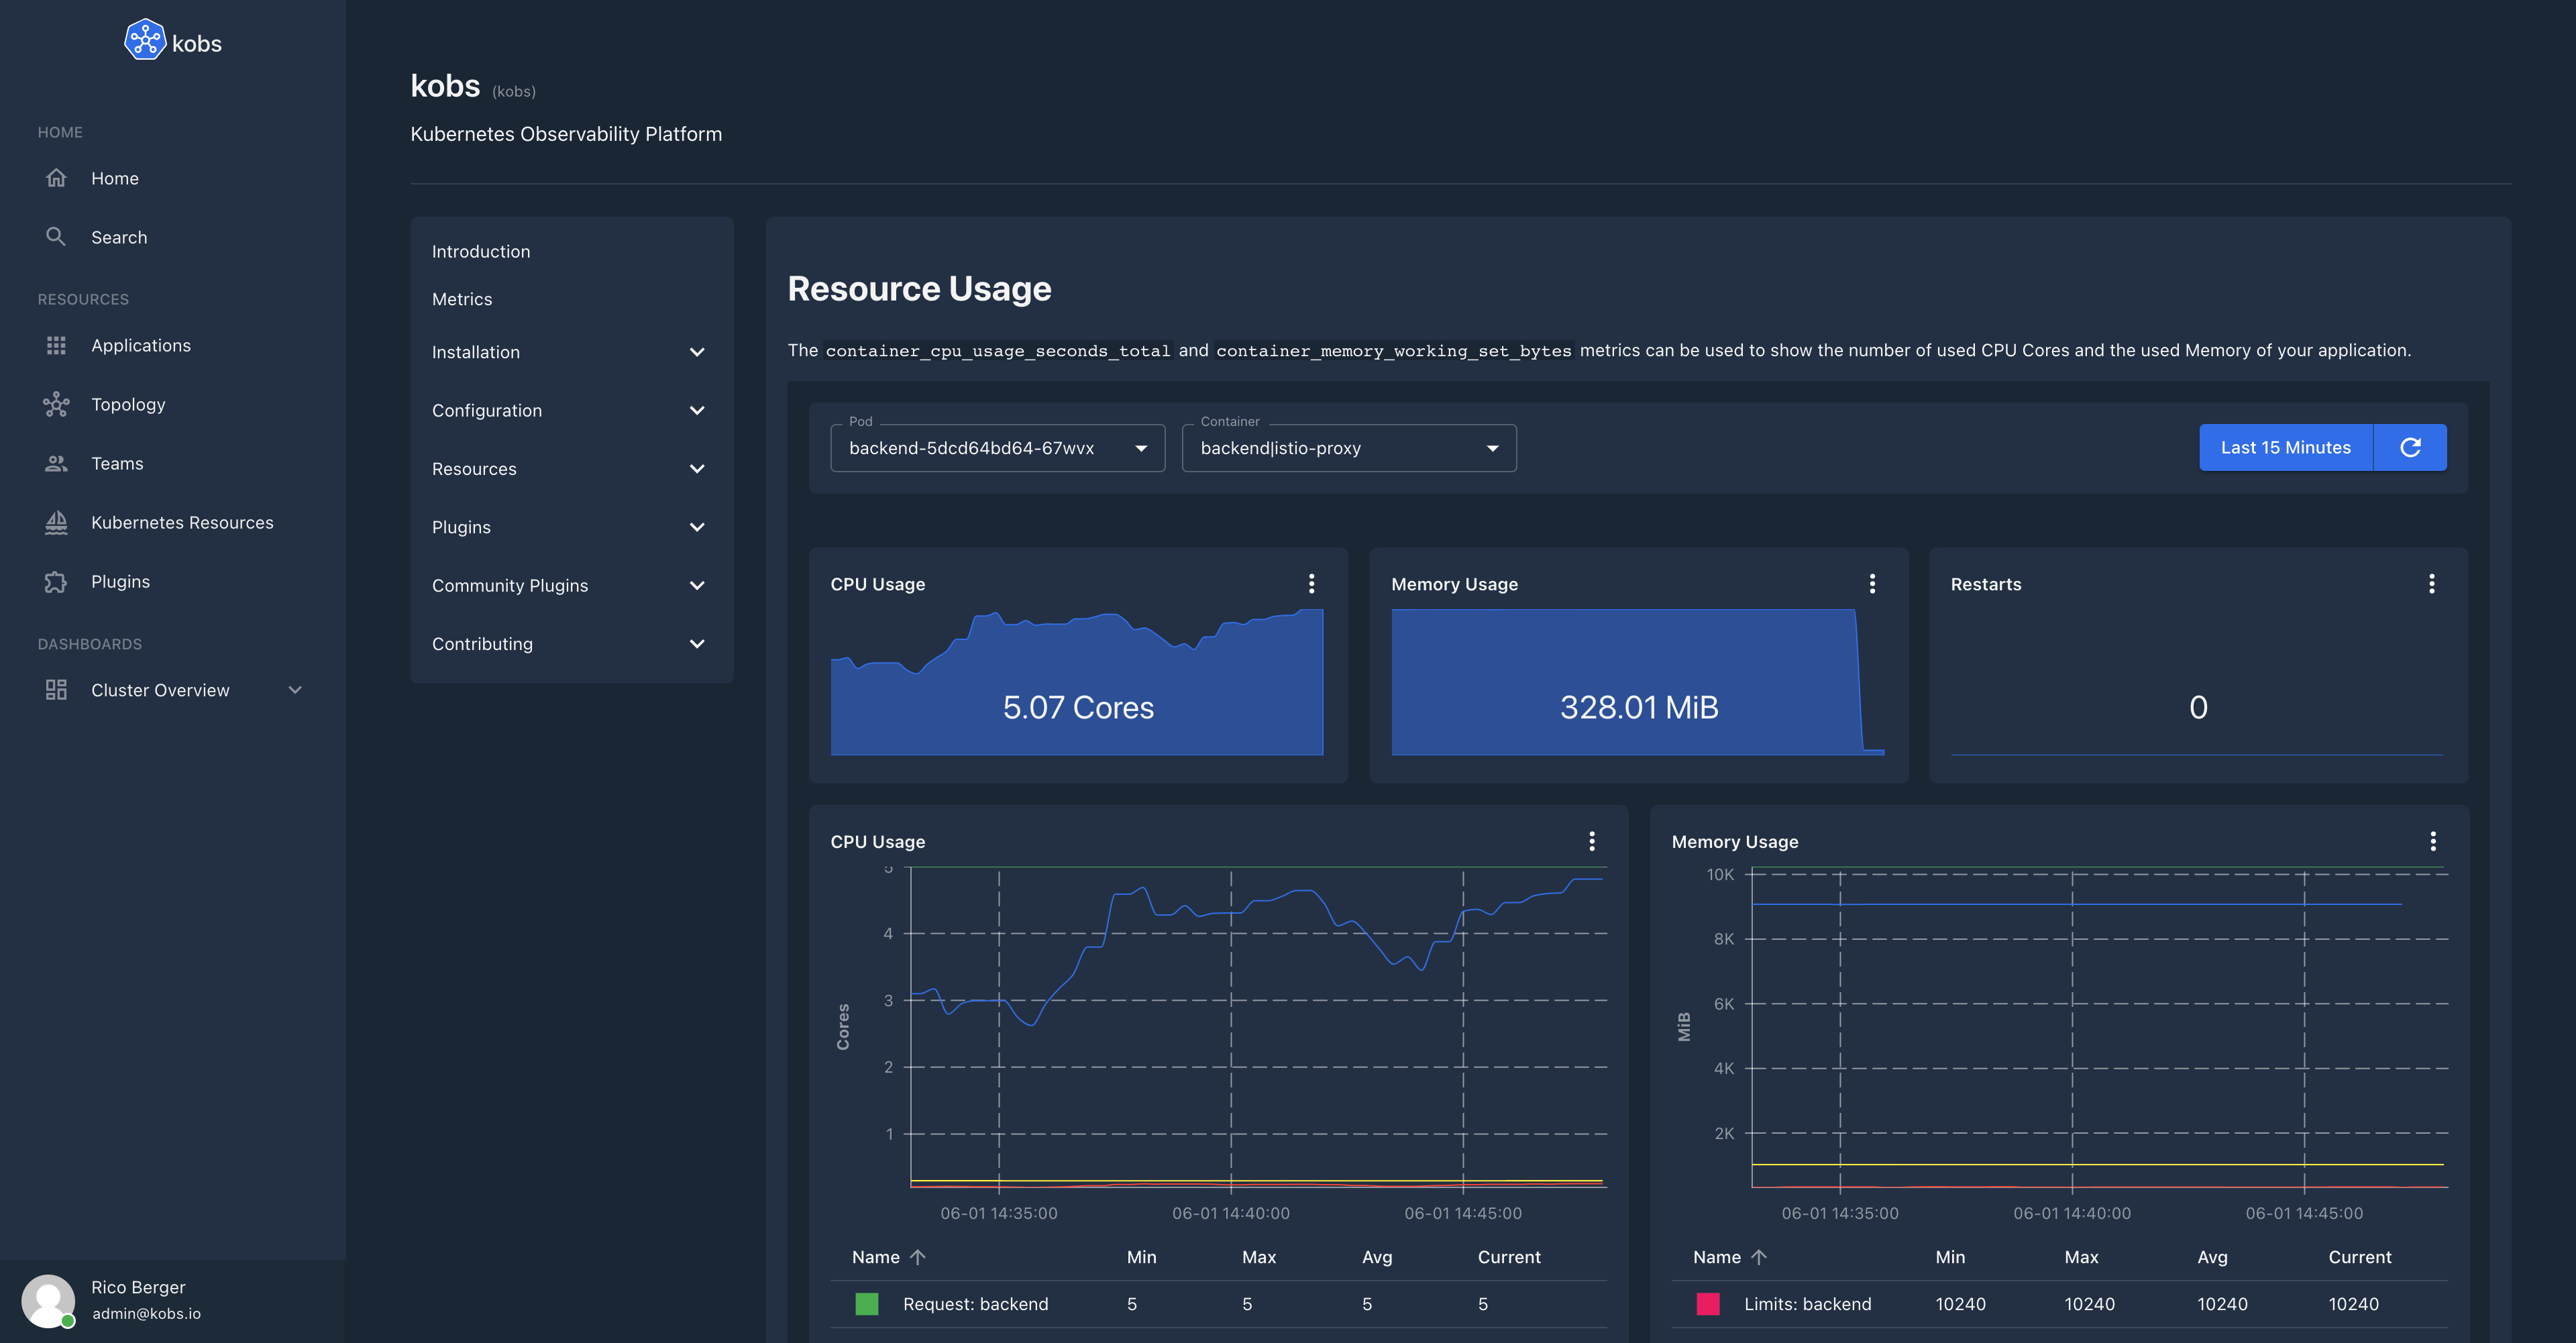
Embed kobs Dashboards
Similar to the panels you can also embed complete dashboards within your documentation. To add a dashboard you have to use a code block with the kobs:dashboard annotation.
# Resource Usage

The `container_cpu_usage_seconds_total` and `container_memory_working_set_bytes` metrics can be used to show the number of used CPU Cores and the used Memory of your application.

```kobs:dashboard
- title: 'Resource Usage'
  inline:
    variables:
      - name: var_pod
        label: Pod
        includeAllOption: false
        plugin:
          type: prometheus
          name: prometheus
          cluster: prod-de1
          options:
            type: labelValues
            label: pod
            query: container_cpu_usage_seconds_total{namespace="backend", image!="", pod=~"backend-.*", container!="POD", container!=""}
      - name: var_container
        label: Container
        includeAllOption: true
        plugin:
          type: prometheus
          name: prometheus
          cluster: prod-de1
          options:
            type: labelValues
            label: container
            query: container_cpu_usage_seconds_total{namespace="backend", image!="", pod=~"{% .var_pod %}", container!="POD", container!=""}
    rows:
      - panels:
          - title: CPU Usage
            plugin:
              type: prometheus
              name: prometheus
              cluster: prod-de1
              options:
                queries:
                  - query: >-
                      sum(rate(container_cpu_usage_seconds_total{namespace="backend", image!="", pod=~"{% .var_pod %}",
                      container!="POD", container!="", container=~"{%
                      .var_container %}"}[2m]))
                type: sparkline
                unit: Cores
            h: 4
            w: 4
            x: 0
            'y': 0
          - title: Memory Usage
            plugin:
              type: prometheus
              name: prometheus
              cluster: prod-de1
              options:
                queries:
                  - query: >-
                      sum(container_memory_working_set_bytes{namespace="backend", pod=~"{% .var_pod %}", container!="POD",
                      container!="", container=~"{% .var_container %}"}) /
                      1024 / 1024
                type: sparkline
                unit: MiB
            h: 4
            w: 4
            x: 4
            'y': 0
          - title: Restarts
            plugin:
              type: prometheus
              name: prometheus
              cluster: prod-de1
              options:
                queries:
                  - query: >-
                      kube_pod_container_status_restarts_total{namespace="backend", pod=~"{% .var_pod %}", container=~"{%
                      .var_container %}"}
                type: sparkline
            h: 4
            w: 4
            x: 8
            'y': 0
      - panels:
          - title: CPU Usage
            plugin:
              type: prometheus
              name: prometheus
              cluster: prod-de1
              options:
                legend: table
                queries:
                  - label: 'Usage: {% .container %}'
                    query: >-
                      sum(rate(container_cpu_usage_seconds_total{namespace="backend", image!="", pod=~"{% .var_pod %}",
                      container!="POD", container!="", container=~"{%
                      .var_container %}"}[2m])) by (container)
                  - label: 'Request: {% .container %}'
                    query: >-
                      sum(kube_pod_container_resource_requests{namespace="backend", resource="cpu", pod=~"{% .var_pod %}",
                      container!="POD", container!="", container=~"{%
                      .var_container %}"}) by (container)
                type: line
                unit: Cores
            h: 9
            w: 6
            x: 0
            'y': 0
          - title: Memory Usage
            plugin:
              type: prometheus
              name: prometheus
              cluster: prod-de1
              options:
                legend: table
                queries:
                  - label: 'Usage: {% .container %}'
                    query: >-
                      sum(container_memory_working_set_bytes{namespace="backend", pod=~"{% .var_pod %}", container!="POD",
                      container!="", container=~"{% .var_container %}"}) by
                      (container) / 1024 / 1024
                  - label: 'Request: {% .container %}'
                    query: >-
                      sum(kube_pod_container_resource_requests{namespace="backend", resource="memory", pod=~"{% .var_pod
                      %}", container!="POD", container!="", container=~"{%
                      .var_container %}"}) by (container) / 1024 / 1024
                  - label: 'Limits: {% .container %}'
                    query: >-
                      sum(kube_pod_container_resource_limits{namespace="backend", resource="memory", pod=~"{% .var_pod
                      %}", container!="POD", container!="", container=~"{%
                      .var_container %}"}) by (container) / 1024 / 1024
                type: line
                unit: MiB
            h: 9
            w: 6
            x: 6
            'y': 0
```