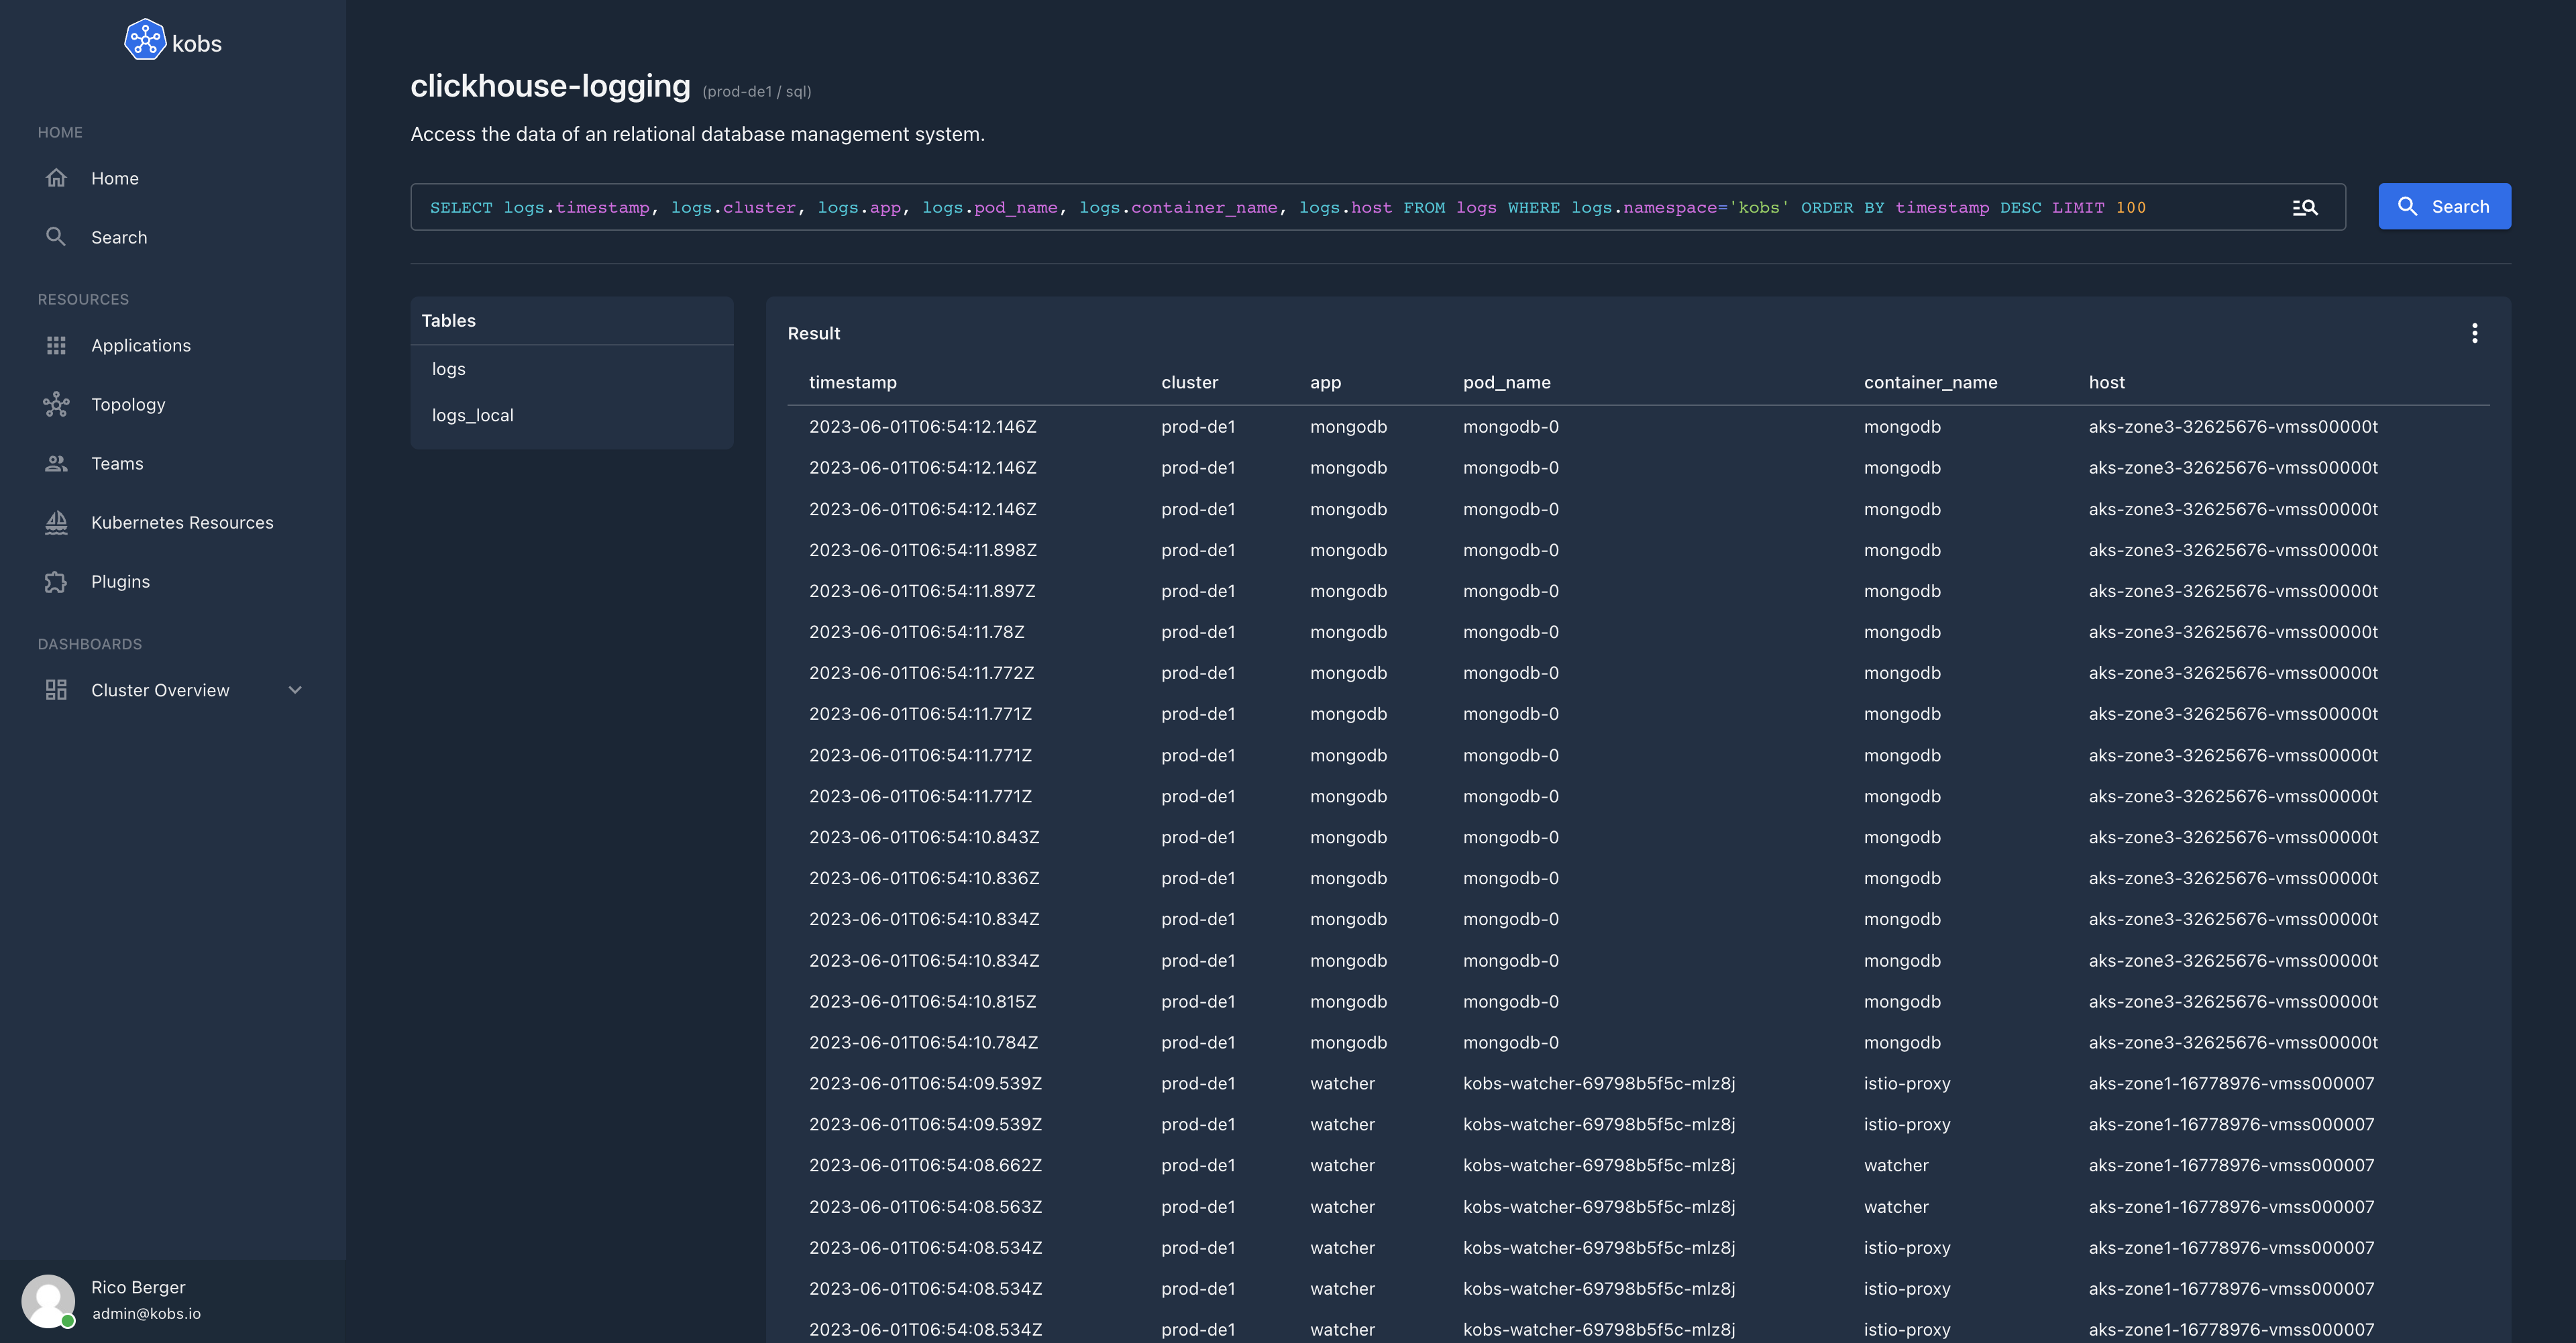
SQL
The SQL plugin can be used to get run queries against a SQL database. Currently we are supporting ClickHouse, Postgres and MySQL databases.
Configuration
The SQL plugin can be used within the hub or cluster. To use the SQL plugin the following configuration is needed:
| Field | Type | Description | Required |
|---|---|---|---|
| name | string | The name of the SQL plugin instance. | Yes |
| type | sql |
The type for the SQL plugin. | Yes |
| options.driver | string | The driver which should be used for the database instance. This must be clickhouse, postgres, mysql or bigquery. |
Yes |
| options.address | string | The connection string, to connect to a SQL database. | Yes |
| options.database | string | The name of the database. | Yes |
plugins:
  - name: sql
    type: sql
    options:
      driver:
      address:
      database:
Insight Options
Note
The SQL plugin can not be used within the insights section of an application.
Variable Options
Note
The SQL plugin can not be used to get a list of variable values.
Panel Options
The following options can be used for a panel with the SQL plugin:
| Field | Type | Description | Required |
|---|---|---|---|
| type | string | The type which should be used to visualize the data. This can be table or chart. |
Yes |
| queries | []Query | A list of queries, which can be selected by the user. This is required when the type is set to table. |
No |
| chart | Chart | Settings to render the results of a query in a chart. This is required when the type is set to chart. |
No |
Query
| Field | Type | Description | Required |
|---|---|---|---|
| name | string | A name for the SQL query, which is displayed in the select box. | Yes |
| query | string | The query which should be run against the configured SQL database. | Yes |
| columns | map |
A map of columns to format the returned data for a query. The key must match the returned column name. | No |
Column
| Field | Type | Description | Required |
|---|---|---|---|
| title | string | Set a title for the column. | No |
| unit | string | A unit which should be displayed behind the column value. If this is time we automatically try to auto format the column to the users local time. |
No |
Chart
| Field | Type | Description | Required |
|---|---|---|---|
| type | string | The chart type. This could be pie, line, area, bar or singlestats. |
Yes |
| query | string | The query which which results should be used in the chart. | Yes |
| pieLabelColumn | string | The name of the column which should be used for the labels in the pie chart. This is required when the type is pie. |
No |
| pieValueColumn | string | The name of the column which should be used for the values in the pie chart. This is required when the type is pie. |
No |
| xAxisColumn | string | The column which should be used for the x axis. This is required when the type is line or area. |
No |
| xAxisType | string | The type for the x axis. This could be empty or time. |
No |
| xAxisUnit | string | The unit which should be used for the x axis. | No |
| yAxisColumns | []string | A list of columns which should be shown for the y axis. This is required when the type is line or area. |
No |
| yAxisUnit | string | The unit for the y axis. | No |
| yAxisGroup | string | The name of the column, which values should be used to group the data. | No |
| yAxisStacked | boolean | When this is true the values of the y axis are stacked. |
No |
| legend | map |
A map of string pairs, to set the displayed title for a column in the legend. The key is the column name as returned by the query and the value is the shown title. | No |
| thresholds | map |
A map of string pairs, to set the background color in a singlestats chart. |
No |
Usage
Example 1
---
apiVersion: kobs.io/v1
kind: Application
metadata:
name: default
namespace: default
spec:
description: The default application is an application to test all available kobs plugins.
dashboards:
- title: Latency
inline:
rows:
- panels:
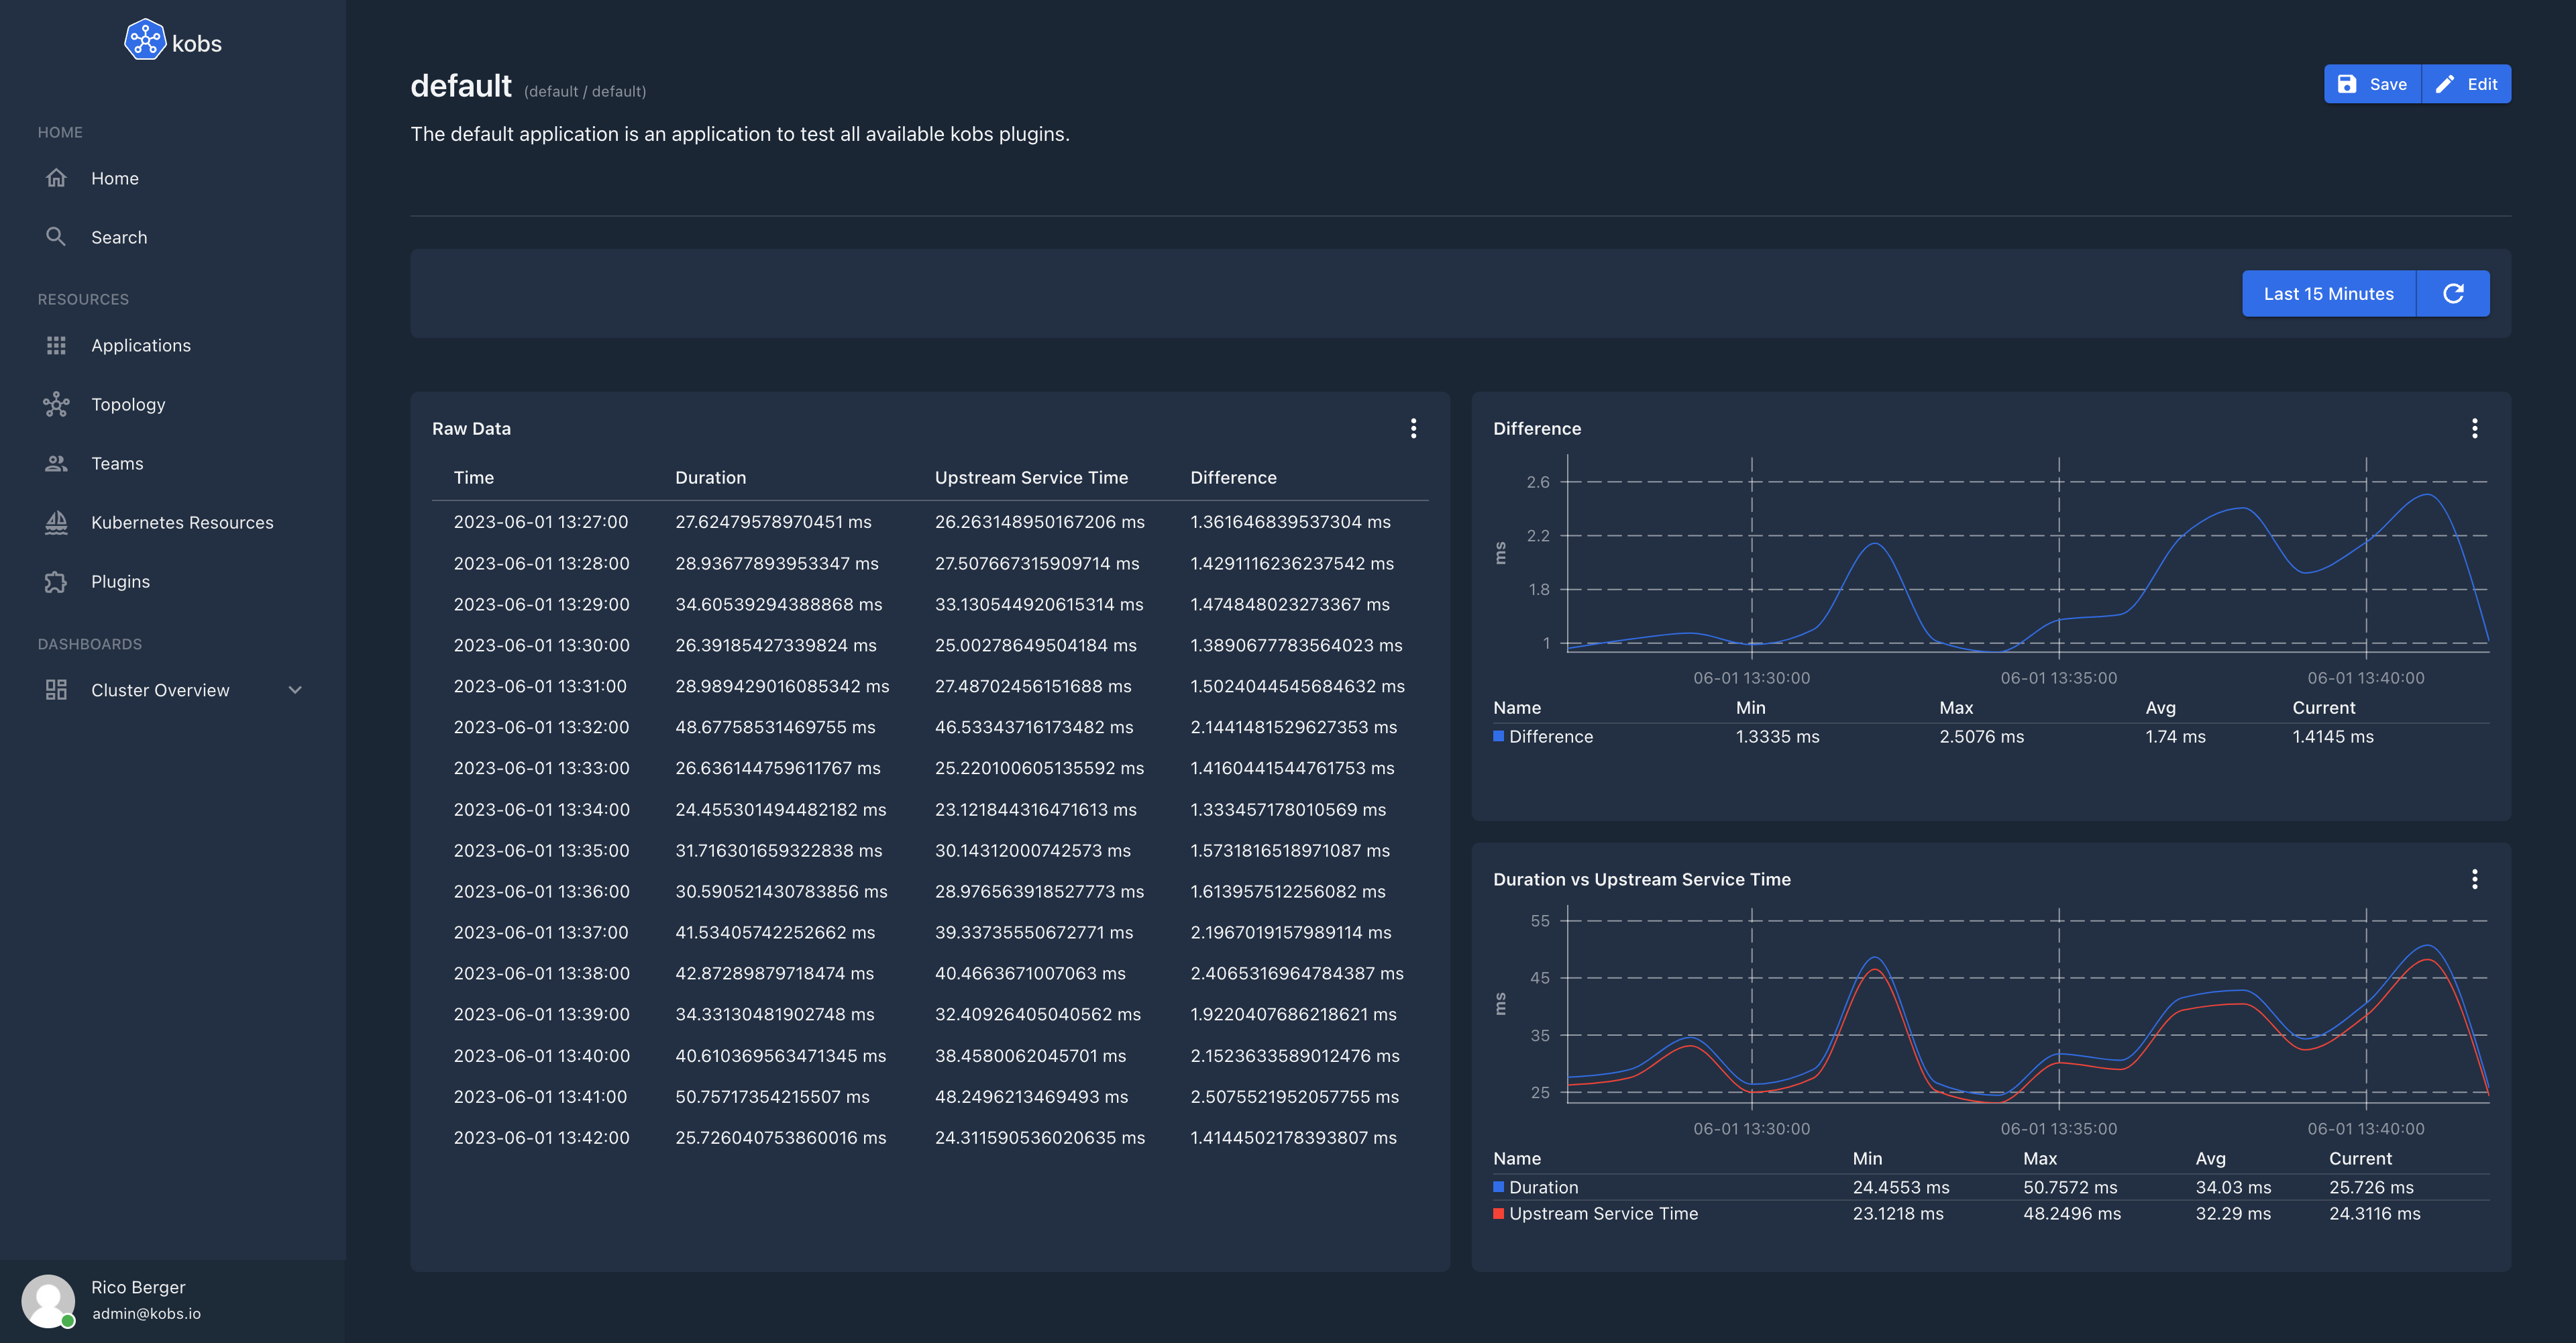
- title: Raw Data
plugin:
name: clickhouse-logging
type: sql
options:
type: table
queries:
- name: Duration and Upstream Service Time
query: |
SELECT
toStartOfInterval(timestamp, INTERVAL 60 second) AS time,
avg(fields_number['content_duration']) as avg_duration,
avg(fields_number['content_upstream_service_time']) as avg_ust,
avg_duration - avg_ust as avg_diff
FROM
logs.logs
WHERE
timestamp >= FROM_UNIXTIME({% .__timeStart %})
AND timestamp <= FROM_UNIXTIME({% .__timeEnd %})
AND namespace='myservice'
AND app='myservice'
AND container_name='istio-proxy'
AND match(fields_string['content_upstream_cluster'], '^inbound.*')
GROUP BY
time
ORDER BY
time
columns:
time:
title: Time
unit: time
avg_duration:
title: Duration
unit: ms
avg_ust:
title: Upstream Service Time
unit: ms
avg_diff:
title: Difference
unit: ms
h: 14
w: 6
x: 0
'y': 0
- title: Difference
plugin:
name: clickhouse-logging
type: sql
options:
type: chart
chart:
type: line
query: |
SELECT
toStartOfInterval(timestamp, INTERVAL 60 second) AS time,
avg(fields_number['content_duration']) - avg(fields_number['content_upstream_service_time']) as avg_diff
FROM
logs.logs
WHERE
timestamp >= FROM_UNIXTIME({% .__timeStart %})
AND timestamp <= FROM_UNIXTIME({% .__timeEnd %})
AND namespace='myservice'
AND app='myservice'
AND container_name='istio-proxy'
AND match(fields_string['content_upstream_cluster'], '^inbound.*')
GROUP BY
time
ORDER BY
time
xAxisColumn: time
xAxisType: time
yAxisColumns:
- avg_diff
yAxisUnit: ms
yAxisStacked: false
legend:
avg_diff: Difference
h: 7
w: 6
x: 6
'y': 0
- title: Duration vs Upstream Service Time
plugin:
name: clickhouse-logging
type: sql
options:
type: chart
chart:
type: line
query: |
SELECT
toStartOfInterval(timestamp, INTERVAL 60 second) AS time,
avg(fields_number['content_duration']) as avg_duration,
avg(fields_number['content_upstream_service_time']) as avg_ust
FROM
logs.logs
WHERE
timestamp >= FROM_UNIXTIME({% .__timeStart %})
AND timestamp <= FROM_UNIXTIME({% .__timeEnd %})
AND namespace='myservice'
AND app='myservice'
AND container_name='istio-proxy'
AND match(fields_string['content_upstream_cluster'], '^inbound.*')
GROUP BY
time
ORDER BY
time
xAxisColumn: time
xAxisType: time
yAxisColumns:
- avg_duration
- avg_ust
yAxisUnit: ms
yAxisStacked: false
legend:
avg_duration: Duration
avg_ust: Upstream Service Time
h: 7
w: 6
x: 6
'y': 7
Example 2
---
apiVersion: kobs.io/v1
kind: Application
metadata:
name: default
namespace: default
spec:
description: The default application is an application to test all available kobs plugins.
dashboards:
- title: Log Levels
inline:
rows:
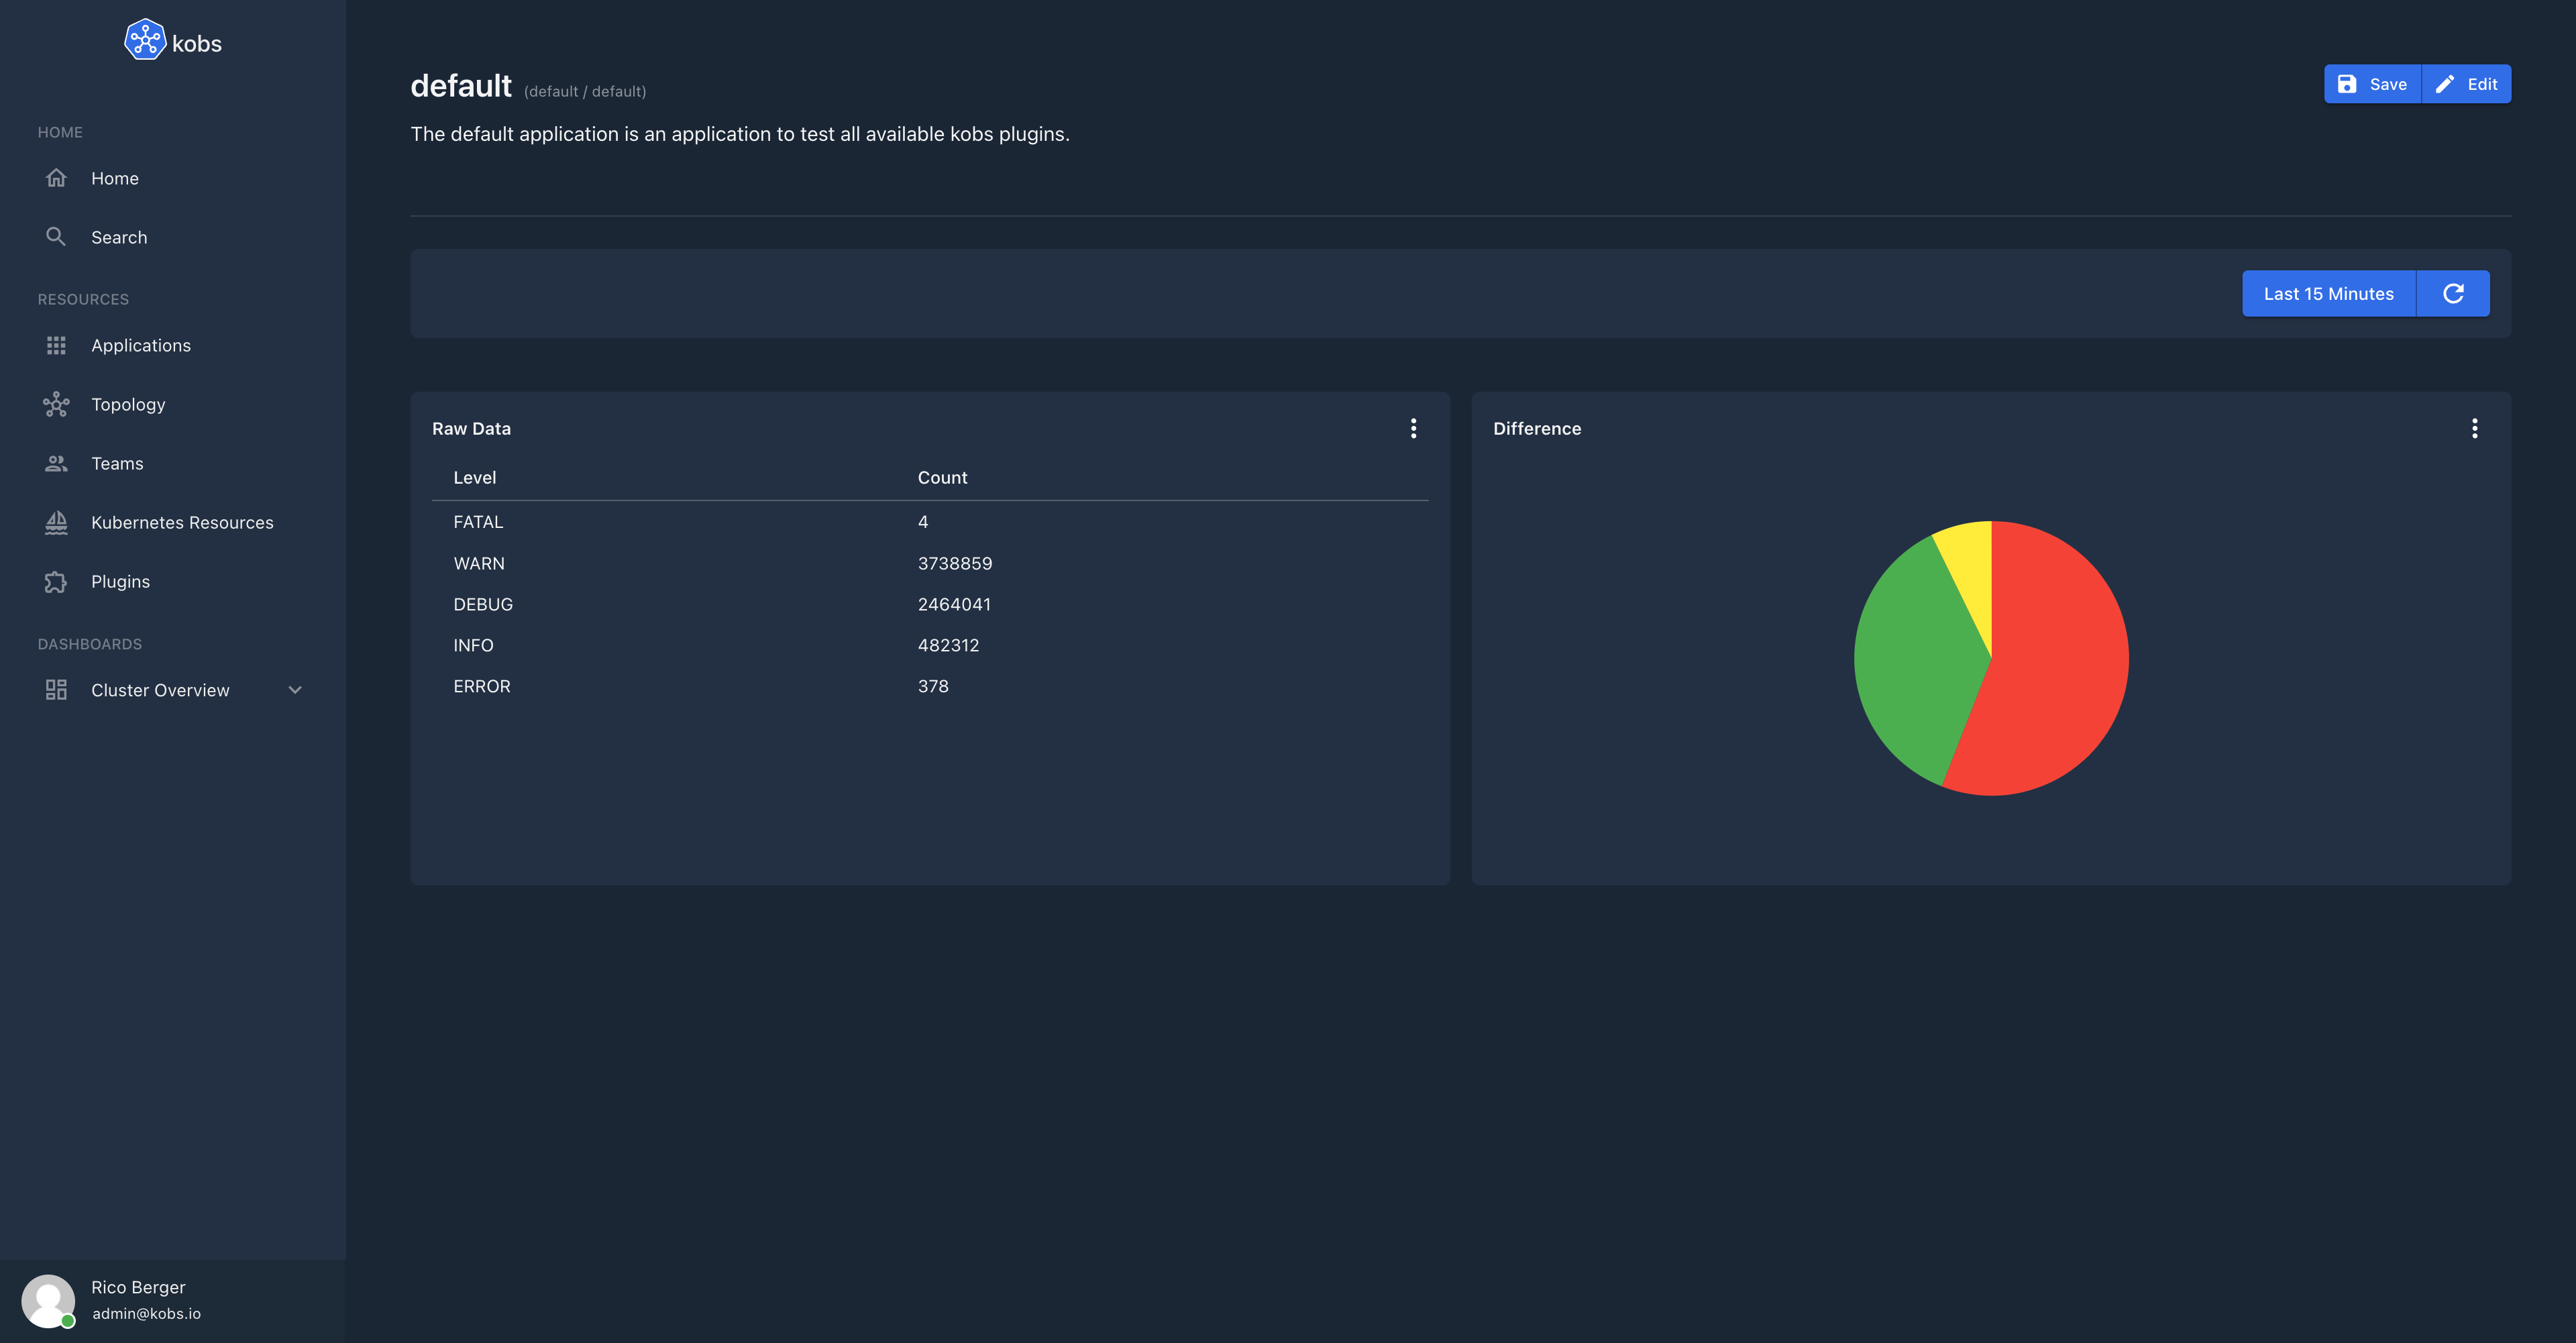
- panels:
- title: Log Levels
plugin:
name: clickhouse-logging
type: sql
options:
type: table
queries:
- name: Log Levels
query: |
SELECT
content_level,
count(content_level) as count_data
FROM
logs.logs
WHERE
timestamp >= FROM_UNIXTIME({% .__timeStart %})
AND timestamp <= FROM_UNIXTIME({% .__timeEnd %})
AND namespace='myservice'
AND app='myservice'
AND container_name='myservice'
GROUP BY
content_level
columns:
content_level:
title: Level
count_data:
title: Count
h: 8
w: 6
x: 0
'y': 0
- title: Log Level Distribution
plugin:
name: clickhouse-logging
type: sql
options:
type: chart
chart:
type: pie
query: |
SELECT
content_level,
count(content_level) as count_data
FROM
logs.logs
WHERE
timestamp >= FROM_UNIXTIME({% .__timeStart %})
AND timestamp <= FROM_UNIXTIME({% .__timeEnd %})
AND namespace='myservice'
AND app='myservice'
AND container_name='myservice'
GROUP BY
content_level
pieLabelColumn: content_level
pieValueColumn: count_data
h: 8
w: 6
x: 6
'y': 0
Example 3
---
apiVersion: kobs.io/v1
kind: Application
metadata:
name: default
namespace: default
spec:
description: The default application is an application to test all available kobs plugins.
dashboards:
- title: Latency
inline:
rows:
- panels:
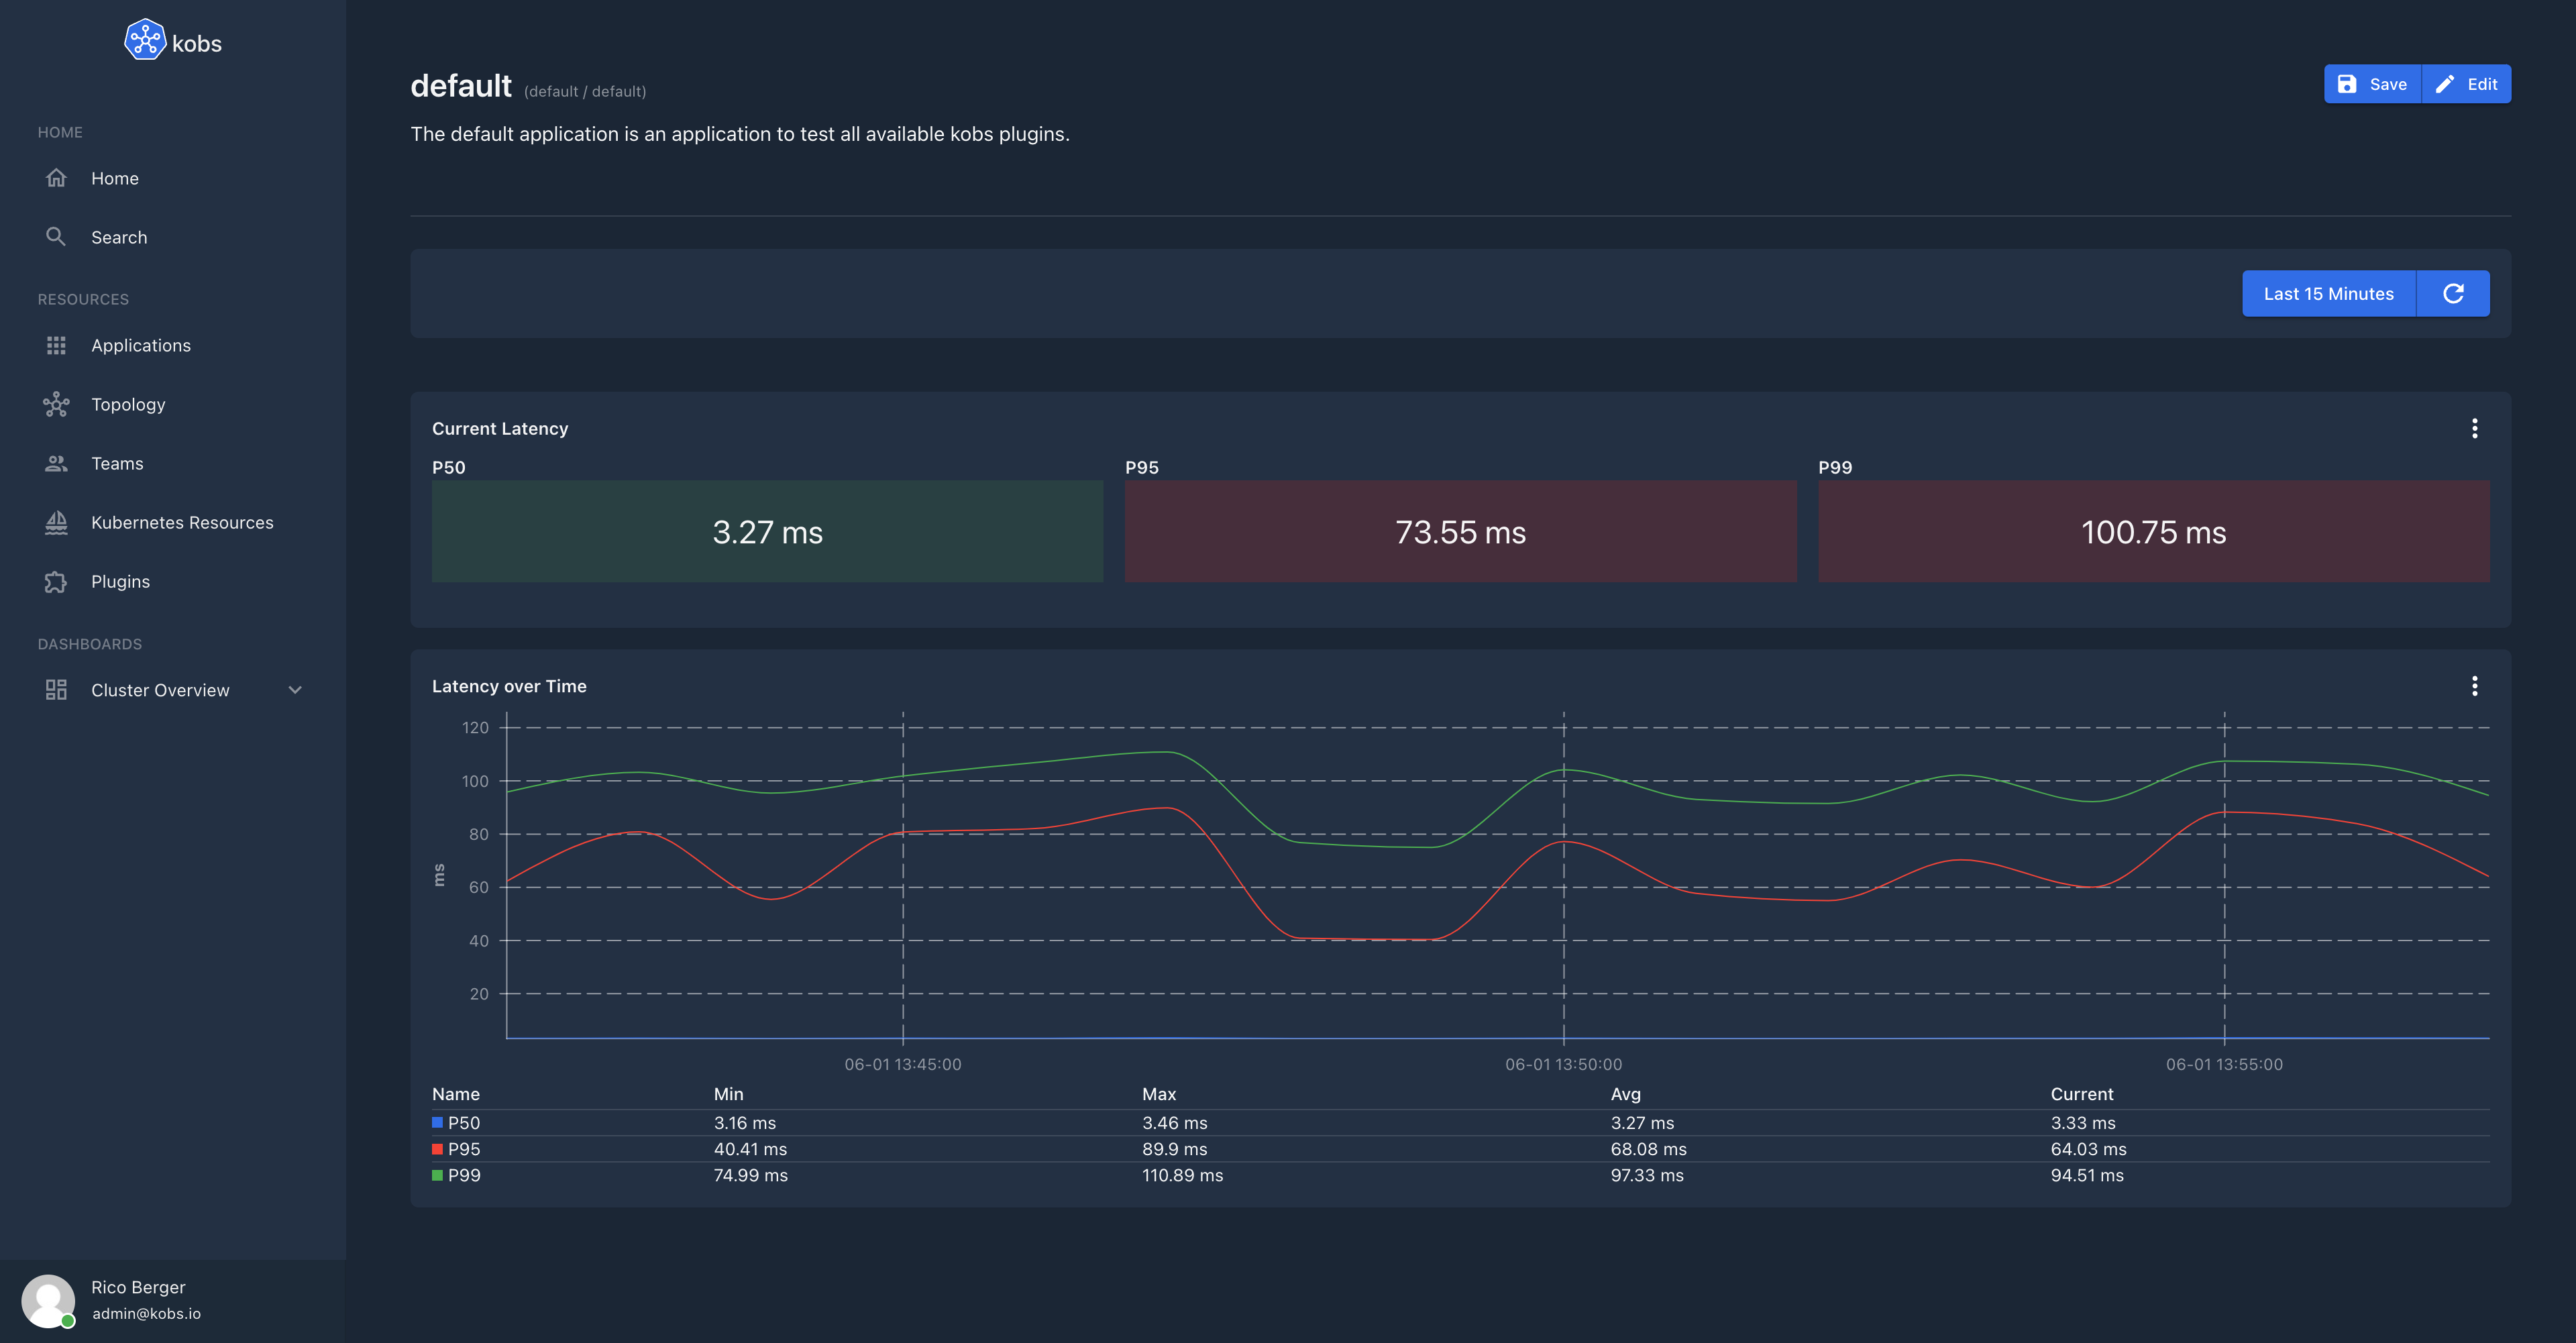
- title: Current Latency
plugin:
name: clickhouse-tracing
type: sql
options:
type: chart
chart:
type: singlestats
query: |
SELECT
floor(quantile(0.5)(JSONExtractInt(model, 'duration')) / 1000000, 2) as p50,
floor(quantile(0.95)(JSONExtractInt(model, 'duration')) / 1000000, 2) as p95,
floor(quantile(0.99)(JSONExtractInt(model, 'duration')) / 1000000, 2) as p99
FROM
(
SELECT * FROM jaeger_spans
WHERE
timestamp >= FROM_UNIXTIME({% .__timeStart %})
AND timestamp <= FROM_UNIXTIME({% .__timeEnd %})
AND JSONExtractString(model, 'operation_name') = 'async envoy.service.auth.v3.Authorization.Check egress'
)
yAxisColumns:
- p50
- p95
- p99
yAxisUnit: ms
legend:
p50: P50
p95: P95
p99: P99
thresholds:
'4': '#F0AB00'
'6': '#C9190B'
'-1024': '#3E8635'
h: 4
w: 12
x: 0
'y': 0
- title: Latency over Time
plugin:
name: clickhouse-tracing
type: sql
options:
type: chart
chart:
type: line
query: |
SELECT
toStartOfInterval(timestamp, INTERVAL 60 second) AS time,
floor(quantile(0.5)(JSONExtractInt(model, 'duration')) / 1000000, 2) as p50,
floor(quantile(0.95)(JSONExtractInt(model, 'duration')) / 1000000, 2) as p95,
floor(quantile(0.99)(JSONExtractInt(model, 'duration')) / 1000000, 2) as p99
FROM
(
SELECT * FROM jaeger_spans
WHERE
timestamp >= FROM_UNIXTIME({% .__timeStart %})
AND timestamp <= FROM_UNIXTIME({% .__timeEnd %})
AND JSONExtractString(model, 'operation_name') = 'async envoy.service.auth.v3.Authorization.Check egress'
)
GROUP BY time
ORDER BY time
xAxisColumn: time
xAxisType: time
yAxisColumns:
- p50
- p95
- p99
yAxisUnit: ms
legend:
p50: P50
p95: P95
p99: P99
h: 9
w: 12
x: 0
'y': 4