Dashboards
Dashboards are defined via the Dashboard Custom Resource Definition. Dashboards are used to add additional information for applications, users and teams via all the configured plugins.
Specification
| Field | Type | Description | Required |
|---|---|---|---|
| description | string | Provide a descriptions for the dashboard with additional details. | No |
| hideToolbar | boolean | If this is true the toolbar will be hidden in the dashboard. |
No |
| defaultTime | boolean | Set the default time interval used for a dashboard. Must be last12Hours, last15Minutes, last1Day, last1Hour, last1Year, last2Days, last30Days, last30Minutes, last3Hours, last5Minutes, last6Hours, last6Months, last7Days or last90Days. The default value is last15Minutes. |
No |
| placeholders | []Placeholder | A list of placeholders, which can be directly set by the user. | No |
| variables | []Variable | A list of variables, where the values are loaded by the specified plugin. | No |
| rows | []Row | A list of rows for the dashboard. | Yes |
Placeholder
| Field | Type | Description | Required |
|---|---|---|---|
| name | string | The name for the placeholder, which can be used in the dashboard via {% .<placeholder-name> %}. |
Yes |
| description | string | An optional description, to provide more information how the placeholder is used. | No |
| default | string | A default value for the placeholder, when it is not provided in a dashboard reference. | No |
| type | string | The type of the placeholder value. This could be string, number or object. The default value is string. |
No |
Variable
| Field | Type | Description | Required |
|---|---|---|---|
| name | string | The name of the variable, which can be used in the dashboard via {% .<variable-name> %}. |
Yes |
| label | string | An optional label, which is shown in the UI instead of the variable name. | No |
| hide | boolean | Hide the variable in the UI. | No |
| includeAllOption | boolean | Add a special value, which includes all other values for the variable | No |
| plugin | Plugin | The plugin, which should be used to get the values for the variable. | Yes |
Note
Dashboards are also supporting some special variables, which always can be used and must not be defined by a users. These variables are:
__timeStart: The start time of the selected time range in seconds. This variable can be used via{% .__timeStart %}in a dashboard.__timeEnd: The end time of the selected time range in seconds. This variable can be used via{% .__timeEnd %}in a dashboard.
Row
| Field | Type | Description | Required |
|---|---|---|---|
| title | string | The title for a row. | No |
| description | string | The description for the row, to provide additional details about the content of the row. | No |
| if | string | An optional condition which must evaluate to true so that the row is displayed. For example the following condition checks that the dashboards placeholder is not empty, to display a row: '"{% .dashboards %}" !== ""' |
No |
| autoHeight | string | Automatically calculate the height of all panels for a row, based on the panel content. | No |
| panels | []Panel | A list of panels for the row. | Yes |
Panel
| Field | Type | Description | Required |
|---|---|---|---|
| title | string | The title of the panel. | Yes |
| description | string | An optional description with additional information about the panel. | No |
| x | number | The x coordinate of the panel in the row. | Yes |
| y | number | The y coordinate of the panel in the row. | Yes |
| w | number | The width of the panel. | Yes |
| h | number | The height of the panel. | Yes |
| plugin | Plugin | The plugin which should be displayed in the panel. | Yes |
Example
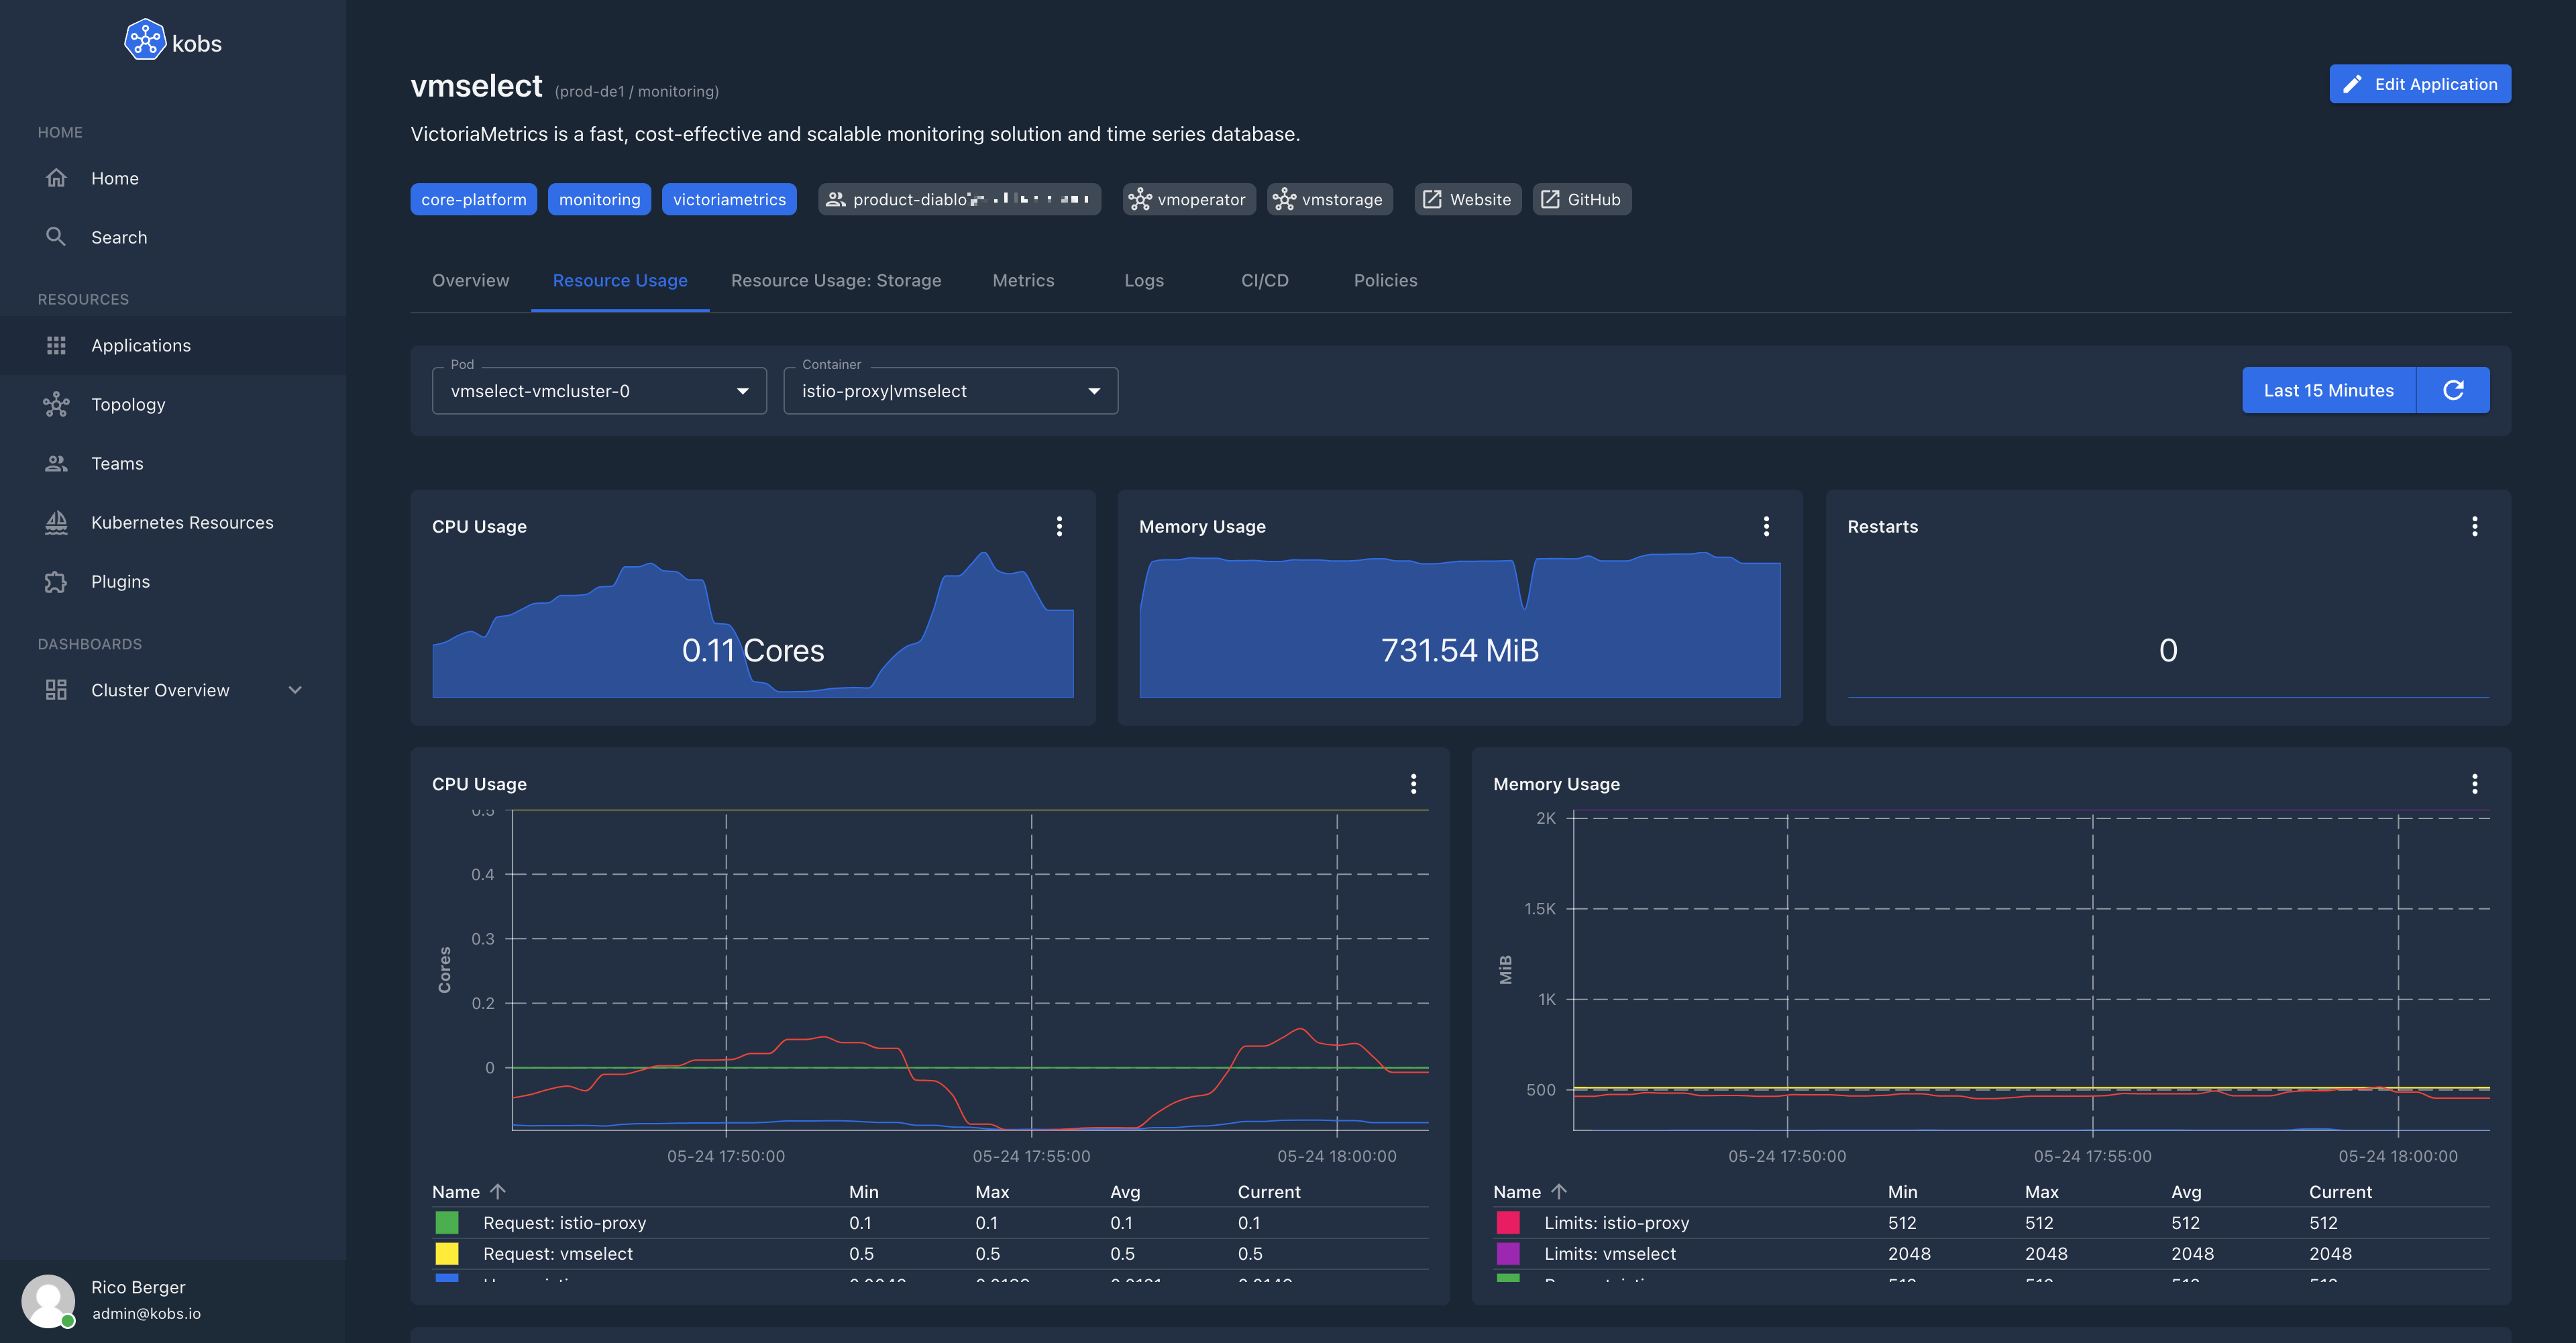
The following dashboard can be used to display the resource usage of the containers in a pod. It can be used within an application and can be customized via the namespace and pod placeholders.
Dashboard
---
apiVersion: kobs.io/v1
kind: Dashboard
metadata:
  name: resource-usage
  namespace: kobs
spec:
  description: Resources Usage of Pods
  placeholders:
    - name: namespace
      description: |
        The namespace of the application, e.g.
            namespace: "<% $.namespace %>"
    - name: pod
      description: |
        A selector for the Pods of the application,
        must be a valid PromQL selector, e.g.
            pod: "<% $.name %>-.*"
    - name: verticalpodautoscaler
      description: |
        The identifier for the VerticalPodAutoscaler,
        must be a valid PromQL selector, e.g.
            verticalpodautoscaler: "<% $.name %>"
  variables:
    - name: var_pod
      label: Pod
      includeAllOption: false
      plugin:
        name: prometheus
        type: prometheus
        options:
          type: labelValues
          label: pod
          query: container_cpu_usage_seconds_total{namespace="{% .namespace %}", image!="", pod=~"{% .pod %}", container!="POD", container!=""}
    - name: var_container
      label: Container
      includeAllOption: true
      plugin:
        name: prometheus
        type: prometheus
        options:
          type: labelValues
          label: container
          query: container_cpu_usage_seconds_total{namespace="{% .namespace %}", image!="", pod=~"{% .var_pod %}", container!="POD", container!=""}
  rows:
    - panels:
        - title: CPU Usage
          plugin:
            type: prometheus
            name: prometheus
            options:
              queries:
                - query: >-
                    sum(rate(container_cpu_usage_seconds_total{namespace="{%
                    .namespace %}", image!="", pod=~"{% .var_pod %}",
                    container!="POD", container!="", container=~"{%
                    .var_container %}"}[2m]))
              type: sparkline
              unit: Cores
          h: 4
          w: 4
          x: 0
          'y': 0
        - title: Memory Usage
          plugin:
            type: prometheus
            name: prometheus
            options:
              queries:
                - query: >-
                    sum(container_memory_working_set_bytes{namespace="{%
                    .namespace %}", pod=~"{% .var_pod %}", container!="POD",
                    container!="", container=~"{% .var_container %}"}) /
                    1024 / 1024
              type: sparkline
              unit: MiB
          h: 4
          w: 4
          x: 4
          'y': 0
        - title: Restarts
          plugin:
            type: prometheus
            name: prometheus
            options:
              queries:
                - query: >-
                    kube_pod_container_status_restarts_total{namespace="{%
                    .namespace %}", pod=~"{% .var_pod %}", container=~"{%
                    .var_container %}"}
              type: sparkline
          h: 4
          w: 4
          x: 8
          'y': 0
    - panels:
        - title: CPU Usage
          plugin:
            type: prometheus
            name: prometheus
            options:
              legend: table
              queries:
                - label: 'Usage: {% .container %}'
                  query: >-
                    sum(rate(container_cpu_usage_seconds_total{namespace="{%
                    .namespace %}", image!="", pod=~"{% .var_pod %}",
                    container!="POD", container!="", container=~"{%
                    .var_container %}"}[2m])) by (container)
                - label: 'Request: {% .container %}'
                  query: >-
                    sum(kube_pod_container_resource_requests{namespace="{%
                    .namespace %}", resource="cpu", pod=~"{% .var_pod %}",
                    container!="POD", container!="", container=~"{%
                    .var_container %}"}) by (container)
              type: line
              unit: Cores
          h: 9
          w: 6
          x: 0
          'y': 0
        - title: Memory Usage
          plugin:
            type: prometheus
            name: prometheus
            options:
              legend: table
              queries:
                - label: 'Usage: {% .container %}'
                  query: >-
                    sum(container_memory_working_set_bytes{namespace="{%
                    .namespace %}", pod=~"{% .var_pod %}", container!="POD",
                    container!="", container=~"{% .var_container %}"}) by
                    (container) / 1024 / 1024
                - label: 'Request: {% .container %}'
                  query: >-
                    sum(kube_pod_container_resource_requests{namespace="{%
                    .namespace %}", resource="memory", pod=~"{% .var_pod
                    %}", container!="POD", container!="", container=~"{%
                    .var_container %}"}) by (container) / 1024 / 1024
                - label: 'Limits: {% .container %}'
                  query: >-
                    sum(kube_pod_container_resource_limits{namespace="{%
                    .namespace %}", resource="memory", pod=~"{% .var_pod
                    %}", container!="POD", container!="", container=~"{%
                    .var_container %}"}) by (container) / 1024 / 1024
              type: line
              unit: MiB
          h: 9
          w: 6
          x: 6
          'y': 0
    - panels:
        - title: Ressource Recommendations
          plugin:
            type: prometheus
            name: prometheus
            options:
              columns:
                - name: target_name
                  title: Target
                - name: container
                  title: Container
                - name: value-1
                  title: Recommended CPU
                  unit: m
                - name: value-2
                  title: Recommended Memory
                  unit: Mi
              queries:
                - label: '{% .target_name %} - {% .container %}'
                  query: >-
                    max(max_over_time(kube_verticalpodautoscaler_status_recommendation_containerrecommendations_target{namespace="{%
                    .namespace %}", container!="POD", container!="", container=~"{% .var_container %}",
                    resource="cpu", verticalpodautoscaler=~"{%
                    .verticalpodautoscaler %}"}[7d]) * 1000) by
                    (target_name, container)
                - label: '{% .target_name %} - {% .container %}'
                  query: >-
                    max(round(max_over_time(kube_verticalpodautoscaler_status_recommendation_containerrecommendations_target{namespace="{%
                    .namespace %}", container!="POD", container!="", container=~"{% .var_container %}",
                    resource="memory", verticalpodautoscaler=~"{%
                    .verticalpodautoscaler %}"}[7d]) / 1000 / 1000)) by
                    (target_name, container)
              type: table
          h: 9
          w: 12
          x: 0
          'y': 0
      autoHeight: true
      description: ''
      if: '"{% .verticalpodautoscaler %}" !== ""'
    - title: Network
      panels:
        - title: Bandwidth
          plugin:
            type: prometheus
            name: prometheus
            options:
              queries:
                - label: Received
                  query: >-
                    sum(irate(container_network_receive_bytes_total{namespace="{%
                    .namespace %}", pod="{% .var_pod %}"}[2m])) by (pod)
                - label: Transmitted
                  query: >-
                    -sum(irate(container_network_transmit_bytes_total{namespace="{%
                    .namespace %}", pod="{% .var_pod %}"}[2m])) by (pod)
              type: area
              unit: bytes/s
          h: 9
          w: 12
          x: 0
          'y': 0
        - title: Rate of Packets
          plugin:
            type: prometheus
            name: prometheus
            options:
              queries:
                - label: Received
                  query: >-
                    sum(irate(container_network_receive_packets_total{namespace=~"{%
                    .namespace %}", pod=~"{% .var_pod %}"}[2m])) by (pod)
                - label: Transmitted
                  query: >-
                    -sum(irate(container_network_transmit_packets_total{namespace=~"{%
                    .namespace %}", pod=~"{% .var_pod %}"}[2m])) by (pod)
              type: area
              unit: p/s
          h: 9
          w: 6
          x: 0
          'y': 9
        - title: Rate of Packets Dropped
          plugin:
            type: prometheus
            name: prometheus
            options:
              queries:
                - label: Received
                  query: >-
                    sum(irate(container_network_receive_packets_dropped_total{namespace=~"{%
                    .namespace %}", pod=~"{% .var_pod %}"}[2m])) by (pod)
                - label: Transmitted
                  query: >-
                    -sum(irate(container_network_transmit_packets_dropped_total{namespace=~"{%
                    .namespace %}", pod=~"{% .var_pod %}"}[2m])) by (pod)
              type: area
              unit: p/s
          h: 9
          w: 6
          x: 6
          'y': 9
The following example shows how complex types for placeholders can be used. In the example the grafana-dashboards dashboard requires a list of dashboards via the dashboards placeholder.
Dashboard
---
apiVersion: kobs.io/v1
kind: Dashboard
metadata:
  name: grafana-dashboards
  namespace: kobs
spec:
  placeholders:
    - name: dashboards
      type: object
  rows:
    - if: '"{% .dashboards %}" !== ""'
      autoHeight: true
      panels:
        - title: Grafana Dashboards
          plugin:
            name: grafana
            type: grafana
            options:
              type: dashboards
              dashboards: '{% .dashboards %}'
          h: 6
          w: 12
          x: 0
          'y': 0
Application
---
apiVersion: kobs.io/v1
kind: Application
metadata:
  name: kobs
  namespace: kobs
spec:
  dashboards:
    - namespace: kobs
      name: test
      title: Grafana Dashboards
      placeholders:
        dashboards: |
          - "vErzsZIVk"
          - "Tf1skG8Mz"
          - "iyJszGUMk"